Showing posts with label confidence. Show all posts

Wednesday, October 29, 2014

We Are All Confident Idiots (via Pacific Standard)

Okay, before you get defensive, not ALL of us . . . but far too many to be comfortable. Whatever happened to saying I don't know, or I have no idea? These are perfectly acceptable answers . . . and they will keep you from looking like a fool on Jimmy Kimmel Live!

We Are All Confident Idiots

• October 27, 2014
Photos by Gregg Segal


confident-idiot

The trouble with ignorance is that it feels so much like expertise. A leading researcher on the psychology of human wrongness sets us straight.
•

Last March, during the enormous South by Southwest music festival in Austin, Texas, the late-night talk show Jimmy Kimmel Live! sent a camera crew out into the streets to catch hipsters bluffing. “People who go to music festivals pride themselves on knowing who the next acts are,” Kimmel said to his studio audience, “even if they don’t actually know who the new acts are.” So the host had his crew ask festival-goers for their thoughts about bands that don’t exist.

“The big buzz on the street,” said one of Kimmel’s interviewers to a man wearing thick-framed glasses and a whimsical T-shirt, “is Contact Dermatitis. Do you think he has what it takes to really make it to the big time?”

“Absolutely,” came the dazed fan’s reply.

The prank was an installment of Kimmel’s recurring “Lie Witness News” feature, which involves asking pedestrians a variety of questions with false premises. In another episode, Kimmel’s crew asked people on Hollywood Boulevard whether they thought the 2014 film Godzilla was insensitive to survivors of the 1954 giant lizard attack on Tokyo; in a third, they asked whether Bill Clinton gets enough credit for ending the Korean War, and whether his appearance as a judge on America’s Got Talent would damage his legacy. “No,” said one woman to this last question. “It will make him even more popular.”

One can’t help but feel for the people who fall into Kimmel’s trap. Some appear willing to say just about anything on camera to hide their cluelessness about the subject at hand (which, of course, has the opposite effect). Others seem eager to please, not wanting to let the interviewer down by giving the most boringly appropriate response: I don’t know. But for some of these interviewees, the trap may be an even deeper one. The most confident-sounding respondents often seem to think they do have some clue—as if there is some fact, some memory, or some intuition that assures them their answer is reasonable.

At one point during South by Southwest, Kimmel’s crew approached a poised young woman with brown hair. “What have you heard about Tonya and the Hardings?” the interviewer asked. “Have you heard they’re kind of hard-hitting?” Failing to pick up on this verbal wink, the woman launched into an elaborate response about the fictitious band. “Yeah, a lot of men have been talking about them, saying they’re really impressed,” she replied. “They’re usually not fans of female groups, but they’re really making a statement.” From some mental gossamer, she was able to spin an authoritative review of Tonya and the Hardings incorporating certain detailed facts: that they’re real; that they’re female (never mind that, say, Marilyn Manson and Alice Cooper aren’t); and that they’re a tough, boundary-breaking group.

To be sure, Kimmel’s producers must cherry-pick the most laughable interviews to put the air. But late-night TV is not the only place where one can catch people extemporizing on topics they know nothing about. In the more solemn confines of a research lab at Cornell University, the psychologists Stav Atir, Emily Rosenzweig, and I carry out ongoing research that amounts to a carefully controlled, less flamboyant version of Jimmy Kimmel’s bit. In our work, we ask survey respondents if they are familiar with certain technical concepts from physics, biology, politics, and geography. A fair number claim familiarity with genuine terms like centripetal force and photon. But interestingly, they also claim some familiarity with concepts that are entirely made up, such as the plates of parallax, ultra-lipid, and cholarine. In one study, roughly 90 percent claimed some knowledge of at least one of the nine fictitious concepts we asked them about. In fact, the more well versed respondents considered themselves in a general topic, the more familiarity they claimed with the meaningless terms associated with it in the survey.

It’s odd to see people who claim political expertise assert their knowledge of both Susan Rice (the national security adviser to President Barack Obama) and Michael Merrington (a pleasant-sounding string of syllables). But it’s not that surprising. For more than 20 years, I have researched people’s understanding of their own expertise—formally known as the study of metacognition, the processes by which human beings evaluate and regulate their knowledge, reasoning, and learning—and the results have been consistently sobering, occasionally comical, and never dull.

The American author and aphorist William Feather once wrote that being educated means “being able to differentiate between what you know and what you don’t.” As it turns out, this simple ideal is extremely hard to achieve. Although what we know is often perceptible to us, even the broad outlines of what we don’t know are all too often completely invisible. To a great degree, we fail to recognize the frequency and scope of our ignorance.

In 1999, in the Journal of Personality and Social Psychology, my then graduate student Justin Kruger and I published a paper that documented how, in many areas of life, incompetent people do not recognize—scratch that, cannot recognize—just how incompetent they are, a phenomenon that has come to be known as the Dunning-Kruger effect. Logic itself almost demands this lack of self-insight: For poor performers to recognize their ineptitude would require them to possess the very expertise they lack. To know how skilled or unskilled you are at using the rules of grammar, for instance, you must have a good working knowledge of those rules, an impossibility among the incompetent. Poor performers—and we are all poor performers at some things—fail to see the flaws in their thinking or the answers they lack.

What’s curious is that, in many cases, incompetence does not leave people disoriented, perplexed, or cautious. Instead, the incompetent are often blessed with an inappropriate confidence, buoyed by something that feels to them like knowledge.

This isn’t just an armchair theory. A whole battery of studies conducted by myself and others have confirmed that people who don’t know much about a given set of cognitive, technical, or social skills tend to grossly overestimate their prowess and performance, whether it’s grammar, emotional intelligence, logical reasoning, firearm care and safety, debating, or financial knowledge. College students who hand in exams that will earn them Ds and Fs tend to think their efforts will be worthy of far higher grades; low-performing chess players, bridge players, and medical students, and elderly people applying for a renewed driver’s license, similarly overestimate their competence by a long shot.

Occasionally, one can even see this tendency at work in the broad movements of history. Among its many causes, the 2008 financial meltdown was precipitated by the collapse of an epic housing bubble stoked by the machinations of financiers and the ignorance of consumers. And recent research suggests that many Americans’ financial ignorance is of the inappropriately confident variety. In 2012, the National Financial Capability Study, conducted by the Financial Industry Regulatory Authority (with the U.S. Treasury), asked roughly 25,000 respondents to rate their own financial knowledge, and then went on to measure their actual financial literacy.


The roughly 800 respondents who said they had filed bankruptcy within the previous two years performed fairly dismally on the test—in the 37th percentile, on average. But they rated their overall financial knowledge more, not less, positively than other respondents did. The difference was slight, but it was beyond a statistical doubt: 23 percent of the recently bankrupted respondents gave themselves the highest possible self-rating; among the rest, only 13 percent did so. Why the self-confidence? Like Jimmy Kimmel’s victims, bankrupted respondents were particularly allergic to saying “I don’t know.” Pointedly, when getting a question wrong, they were 67 percent more likely to endorse a falsehood than their peers were. Thus, with a head full of “knowledge,” they considered their financial literacy to be just fine.

Because it’s so easy to judge the idiocy of others, it may be sorely tempting to think this doesn’t apply to you. But the problem of unrecognized ignorance is one that visits us all. And over the years, I’ve become convinced of one key, overarching fact about the ignorant mind. One should not think of it as uninformed. Rather, one should think of it as misinformed.

An ignorant mind is precisely not a spotless, empty vessel, but one that’s filled with the clutter of irrelevant or misleading life experiences, theories, facts, intuitions, strategies, algorithms, heuristics, metaphors, and hunches that regrettably have the look and feel of useful and accurate knowledge. This clutter is an unfortunate by-product of one of our greatest strengths as a species. We are unbridled pattern recognizers and profligate theorizers. Often, our theories are good enough to get us through the day, or at least to an age when we can procreate. But our genius for creative storytelling, combined with our inability to detect our own ignorance, can sometimes lead to situations that are embarrassing, unfortunate, or downright dangerous—especially in a technologically advanced, complex democratic society that occasionally invests mistaken popular beliefs with immense destructive power (See: crisis, financial; war, Iraq). As the humorist Josh Billings once put it, “It ain’t what you don’t know that gets you into trouble. It’s what you know for sure that just ain’t so.” (Ironically, one thing many people “know” about this quote is that it was first uttered by Mark Twain or Will Rogers—which just ain’t so.)

Because of the way we are built, and because of the way we learn from our environment, we are all engines of misbelief. And the better we understand how our wonderful yet kludge-ridden, Rube Goldberg engine works, the better we—as individuals and as a society—can harness it to navigate toward a more objective understanding of the truth.

BORN WRONG


Some of our deepest intuitions about the world go all the way back to our cradles. Before their second birthday, babies know that two solid objects cannot co-exist in the same space. They know that objects continue to exist when out of sight, and fall if left unsupported. They know that people can get up and move around as autonomous beings, but that the computer sitting on the desk cannot. But not all of our earliest intuitions are so sound.

Very young children also carry misbeliefs that they will harbor, to some degree, for the rest of their lives. Their thinking, for example, is marked by a strong tendency to falsely ascribe intentions, functions, and purposes to organisms. In a child’s mind, the most important biological aspect of a living thing is the role it plays in the realm of all life. Asked why tigers exist, children will emphasize that they were “made for being in a zoo.” Asked why trees produce oxygen, children say they do so to allow animals to breathe.


Any conventional biology or natural science education will attempt to curb this propensity for purpose-driven reasoning. But it never really leaves us. Adults with little formal education show a similar bias. And, when rushed, even professional scientists start making purpose-driven mistakes. The Boston University psychologist Deborah Kelemen and some colleagues demonstrated this in a study that involved asking 80 scientists—people with university jobs in geoscience, chemistry, and physics—to evaluate 100 different statements about “why things happen” in the natural world as true or false. Sprinkled among the explanations were false purpose-driven ones, such as “Moss forms around rocks in order to stop soil erosion” and “The Earth has an ozone layer in order to protect it from UV light.” Study participants were allowed either to work through the task at their own speed, or given only 3.2 seconds to respond to each item. Rushing the scientists caused them to double their endorsements of false purpose-driven explanations, from 15 to 29 percent.

This purpose-driven misconception wreaks particular havoc on attempts to teach one of the most important concepts in modern science: evolutionary theory. Even laypeople who endorse the theory often believe a false version of it. They ascribe a level of agency and organization to evolution that is just not there. If you ask many laypeople their understanding of why, say, cheetahs can run so fast, they will explain it’s because the cats surmised, almost as a group, that they could catch more prey if they could just run faster, and so they acquired the attribute and passed it along to their cubs. Evolution, in this view, is essentially a game of species-level strategy.

This idea of evolution misses the essential role played by individual differences and competition between members of a species in response to environmental pressures: Individual cheetahs who can run faster catch more prey, live longer, and reproduce more successfully; slower cheetahs lose out, and die out—leaving the species to drift toward becoming faster overall. Evolution is the result of random differences and natural selection, not agency or choice.

But belief in the “agency” model of evolution is hard to beat back. While educating people about evolution can indeed lead them from being uninformed to being well informed, in some stubborn instances it also moves them into the confidently misinformed category. In 2014, Tony Yates and Edmund Marek published a study that tracked the effect of high school biology classes on 536 Oklahoma high school students’ understanding of evolutionary theory. The students were rigorously quizzed on their knowledge of evolution before taking introductory biology, and then again just afterward. Not surprisingly, the students’ confidence in their knowledge of evolutionary theory shot up after instruction, and they endorsed a greater number of accurate statements. So far, so good.

The trouble is that the number of misconceptions the group endorsed also shot up. For example, instruction caused the percentage of students strongly agreeing with the true statement “Evolution cannot cause an organism’s traits to change during its lifetime” to rise from 17 to 20 percent—but it also caused those strongly disagreeing to rise from 16 to 19 percent. In response to the likewise true statement “Variation among individuals is important for evolution to occur,” exposure to instruction produced an increase in strong agreement from 11 to 22 percent, but strong disagreement also rose from nine to 12 percent. Tellingly, the only response that uniformly went down after instruction was “I don’t know.”

And it’s not just evolution that bedevils students. Again and again, research has found that conventional educational practices largely fail to eradicate a number of our cradle-born misbeliefs. Education fails to correct people who believe that vision is made possible only because the eye emits some energy or substance into the environment. It fails to correct common intuitions about the trajectory of falling objects. And it fails to disabuse students of the idea that light and heat act under the same laws as material substances. What education often does appear to do, however, is imbue us with confidence in the errors we retain.

MISAPPLIED RULES


Imagine that the illustration below represents a curved tube lying horizontally on a table:

confident-idiot-chart

In a study of intuitive physics in 2013, Elanor Williams, Justin Kruger, and I presented people with several variations on this curved-tube image and asked them to identify the trajectory a ball would take (marked A, B, or C in the illustration) after it had traveled through each. Some people got perfect scores, and seemed to know it, being quite confident in their answers. Some people did a bit less well—and, again, seemed to know it, as their confidence was much more muted.

But something curious started happening as we began to look at the people who did extremely badly on our little quiz. By now, you may be able to predict it: These people expressed more, not less, confidence in their performance. In fact, people who got none of the items right often expressed confidence that matched that of the top performers. Indeed, this study produced the most dramatic example of the Dunning-Kruger effect we had ever seen: When looking only at the confidence of people getting 100 percent versus zero percent right, it was often impossible to tell who was in which group.

Why? Because both groups “knew something.” They knew there was a rigorous, consistent rule that a person should follow to predict the balls’ trajectories. One group knew the right Newtonian principle: that the ball would continue in the direction it was going the instant it left the tube—Path B. Freed of the tube’s constraint, it would just go straight.

People who got every item wrong typically answered that the ball would follow Path A. Essentially, their rule was that the tube would impart some curving impetus to the trajectory of the ball, which it would continue to follow upon its exit. This answer is demonstrably incorrect—but a plurality of people endorse it.

These people are in good company. In 1500 A.D., Path A would have been the accepted answer among sophisticates with an interest in physics. Both Leonardo da Vinci and French philosopher Jean Buridan endorsed it. And it does make some sense. A theory of curved impetus would explain common, everyday puzzles, such as why wheels continue to rotate even after someone stops pushing the cart, or why the planets continue their tight and regular orbits around the sun. With those problems “explained,” it’s an easy step to transfer this explanation to other problems like those involving tubes.

What this study illustrates is another general way—in addition to our cradle-born errors—in which humans frequently generate misbeliefs: We import knowledge from appropriate settings into ones where it is inappropriate.

Here’s another example: According to Pauline Kim, a professor at Washington University Law School, people tend to make inferences about the law based on what they know about more informal social norms. This frequently leads them to misunderstand their rights—and in areas like employment law, to wildly overestimate them. In 1997, Kim presented roughly 300 residents of Buffalo, New York, with a series of morally abhorrent workplace scenarios—for example, an employee is fired for reporting that a co-worker has been stealing from the company—that were nonetheless legal under the state’s “at-will” employment regime. Eighty to 90 percent of the Buffalonians incorrectly identified each of these distasteful scenarios as illegal, revealing how little they understood about how much freedom employers actually enjoy to fire employees. (Why does this matter? Legal scholars had long defended “at-will” employment rules on the grounds that employees consent to them in droves without seeking better terms of employment. What Kim showed was that employees seldom understand what they’re consenting to.)

Doctors, too, are quite familiar with the problem of inappropriately transferred knowledge in their dealings with patients. Often, it’s not the medical condition itself that a physician needs to defeat as much as patient misconceptions that protect it. Elderly patients, for example, frequently refuse to follow a doctor’s advice to exercise to alleviate pain—one of the most effective strategies available—because the physical soreness and discomfort they feel when they exercise is something they associate with injury and deterioration. Research by the behavioral economist Sendhil Mullainathan has found that mothers in India often withhold water from infants with diarrhea because they mistakenly conceive of their children as leaky buckets—rather than as increasingly dehydrated creatures in desperate need of water.

MOTIVATED REASONING


Some of our most stubborn misbeliefs arise not from primitive childlike intuitions or careless category errors, but from the very values and philosophies that define who we are as individuals. Each of us possesses certain foundational beliefs—narratives about the self, ideas about the social order—that essentially cannot be violated: To contradict them would call into question our very self-worth. As such, these views demand fealty from other opinions. And any information that we glean from the world is amended, distorted, diminished, or forgotten in order to make sure that these sacrosanct beliefs remain whole and unharmed.

One very commonly held sacrosanct belief, for example, goes something like this: I am a capable, good, and caring person. Any information that contradicts this premise is liable to meet serious mental resistance. Political and ideological beliefs, too, often cross over into the realm of the sacrosanct. The anthropological theory of cultural cognition suggests that people everywhere tend to sort ideologically into cultural worldviews diverging along a couple of axes: They are either individualist (favoring autonomy, freedom, and self-reliance) or communitarian (giving more weight to benefits and costs borne by the entire community); and they are either hierarchist (favoring the distribution of social duties and resources along a fixed ranking of status) or egalitarian (dismissing the very idea of ranking people according to status). According to the theory of cultural cognition, humans process information in a way that not only reflects these organizing principles, but also reinforces them. These ideological anchor points can have a profound and wide-ranging impact on what people believe, and even on what they “know” to be true.

It is perhaps not so surprising to hear that facts, logic, and knowledge can be bent to accord with a person’s subjective worldview; after all, we accuse our political opponents of this kind of “motivated reasoning” all the time. But the extent of this bending can be remarkable. In ongoing work with the political scientist Peter Enns, my lab has found that a person’s politics can warp other sets of logical or factual beliefs so much that they come into direct contradiction with one another. In a survey of roughly 500 Americans conducted in late 2010, we found that over a quarter of liberals (but only six percent of conservatives) endorsed both the statement “President Obama’s policies have already created a strong revival in the economy” and “Statutes and regulations enacted by the previous Republican presidential administration have made a strong economic recovery impossible.” Both statements are pleasing to the liberal eye and honor a liberal ideology, but how can Obama have already created a strong recovery that Republican policies have rendered impossible? Among conservatives, 27 percent (relative to just 10 percent of liberals) agreed both that “President Obama’s rhetorical skills are elegant but are insufficient to influence major international issues” and that “President Obama has not done enough to use his rhetorical skills to effect regime change in Iraq.” But if Obama’s skills are insufficient, why should he be criticized for not using them to influence the Iraqi government?

Sacrosanct ideological commitments can also drive us to develop quick, intense opinions on topics we know virtually nothing about—topics that, on their face, have nothing to do with ideology. Consider the emerging field of nanotechnology. Nanotech, loosely defined, involves the fabrication of products at the atomic or molecular level that have applications in medicine, energy production, biomaterials, and electronics. Like pretty much any new technology, nanotech carries the promise of great benefit (antibacterial food containers!) and the risk of serious downsides (nano-surveillance technology!).

In 2006, Daniel Kahan, a professor at Yale Law School, performed a study together with some colleagues on public perceptions of nanotechnology. They found, as other surveys had before, that most people knew little to nothing about the field. They also found that ignorance didn’t stop people from opining about whether nanotechnology’s risks outweighed its benefits.

When Kahan surveyed uninformed respondents, their opinions were all over the map. But when he gave another group of respondents a very brief, meticulously balanced description of the promises and perils of nanotech, the remarkable gravitational pull of deeply held sacrosanct beliefs became apparent. With just two paragraphs of scant (though accurate) information to go on, people’s views of nanotechnology split markedly—and aligned with their overall worldviews. Hierarchics/individualists found themselves viewing nanotechnology more favorably. Egalitarians/collectivists took the opposite stance, insisting that nanotechnology has more potential for harm than good.

Why would this be so? Because of underlying beliefs. Hierarchists, who are favorably disposed to people in authority, may respect industry and scientific leaders who trumpet the unproven promise of nanotechnology. Egalitarians, on the other hand, may fear that the new technology could present an advantage that conveys to only a few people. And collectivists might worry that nanotechnology firms will pay insufficient heed to their industry’s effects on the environment and public health. Kahan’s conclusion: If two paragraphs of text are enough to send people on a glide path to polarization, simply giving members of the public more information probably won’t help them arrive at a shared, neutral understanding of the facts; it will just reinforce their biased views.


One might think that opinions about an esoteric technology would be hard to come by. Surely, to know whether nanotech is a boon to humankind or a step toward doomsday would require some sort of knowledge about materials science, engineering, industry structure, regulatory issues, organic chemistry, surface science, semiconductor physics, microfabrication, and molecular biology. Every day, however, people rely on the cognitive clutter in their minds—whether it’s an ideological reflex, a misapplied theory, or a cradle-born intuition—to answer technical, political, and social questions they have little or no direct expertise in. We are never all that far from Tonya and the Hardings.

SEEING THROUGH THE CLUTTER


Unfortunately for all of us, policies and decisions that are founded on ignorance have a strong tendency, sooner or later, to blow up in one’s face. So how can policymakers, teachers, and the rest of us cut through all the counterfeit knowledge—our own and our neighbors’—that stands in the way of our ability to make truly informed judgments?

The way we traditionally conceive of ignorance—as an absence of knowledge—leads us to think of education as its natural antidote. But education, even when done skillfully, can produce illusory confidence. Here’s a particularly frightful example: Driver’s education courses, particularly those aimed at handling emergency maneuvers, tend to increase, rather than decrease, accident rates. They do so because training people to handle, say, snow and ice leaves them with the lasting impression that they’re permanent experts on the subject. In fact, their skills usually erode rapidly after they leave the course. And so, months or even decades later, they have confidence but little leftover competence when their wheels begin to spin.

In cases like this, the most enlightened approach, as proposed by Swedish researcher Nils Petter Gregersen, may be to avoid teaching such skills at all. Instead of training drivers how to negotiate icy conditions, Gregersen suggests, perhaps classes should just convey their inherent danger—they should scare inexperienced students away from driving in winter conditions in the first place, and leave it at that.

But, of course, guarding people from their own ignorance by sheltering them from the risks of life is seldom an option. Actually getting people to part with their misbeliefs is a far trickier, far more important task. Luckily, a science is emerging, led by such scholars as Stephan Lewandowsky at the University of Bristol and Ullrich Ecker of the University of Western Australia, that could help.

In the classroom, some of best techniques for disarming misconceptions are essentially variations on the Socratic method. To eliminate the most common misbeliefs, the instructor can open a lesson with them—and then show students the explanatory gaps those misbeliefs leave yawning or the implausible conclusions they lead to. For example, an instructor might start a discussion of evolution by laying out the purpose-driven evolutionary fallacy, prompting the class to question it. (How do species just magically know what advantages they should develop to confer to their offspring? How do they manage to decide to work as a group?) Such an approach can make the correct theory more memorable when it’s unveiled, and can prompt general improvements in analytical skills.


Then, of course, there is the problem of rampant misinformation in places that, unlike classrooms, are hard to control—like the Internet and news media. In these Wild West settings, it’s best not to repeat common misbeliefs at all. Telling people that Barack Obama is not a Muslim fails to change many people’s minds, because they frequently remember everything that was said—except for the crucial qualifier “not.” Rather, to successfully eradicate a misbelief requires not only removing the misbelief, but filling the void left behind (“Obama was baptized in 1988 as a member of the United Church of Christ”). If repeating the misbelief is absolutely necessary, researchers have found it helps to provide clear and repeated warnings that the misbelief is false. I repeat, false.

The most difficult misconceptions to dispel, of course, are those that reflect sacrosanct beliefs. And the truth is that often these notions can’t be changed. Calling a sacrosanct belief into question calls the entire self into question, and people will actively defend views they hold dear. This kind of threat to a core belief, however, can sometimes be alleviated by giving people the chance to shore up their identity elsewhere. Researchers have found that asking people to describe aspects of themselves that make them proud, or report on values they hold dear, can make any incoming threat seem, well, less threatening.

For example, in a study conducted by Geoffrey Cohen, David Sherman, and other colleagues, self-described American patriots were more receptive to the claims of a report critical of U.S. foreign policy if, beforehand, they wrote an essay about an important aspect of themselves, such as their creativity, sense of humor, or family, and explained why this aspect was particularly meaningful to them. In a second study, in which pro-choice college students negotiated over what federal abortion policy should look like, participants made more concessions to restrictions on abortion after writing similar self-affirmative essays.

Sometimes, too, researchers have found that sacrosanct beliefs themselves can be harnessed to persuade a subject to reconsider a set of facts with less prejudice. For example, conservatives tend not to endorse policies that preserve the environment as much as liberals do. But conservatives do care about issues that involve “purity” in thought, deed, and reality. Casting environmental protection as a chance to preserve the purity of the Earth causes conservatives to favor those policies much more, as research by Matthew Feinberg and Robb Willer of Stanford University suggests. In a similar vein, liberals can be persuaded to raise military spending if such a policy is linked to progressive values like fairness and equity beforehand—by, for instance, noting that the military offers recruits a way out of poverty, or that military promotion standards apply equally to all.

But here is the real challenge: How can we learn to recognize our own ignorance and misbeliefs? To begin with, imagine that you are part of a small group that needs to make a decision about some matter of importance. Behavioral scientists often recommend that small groups appoint someone to serve as a devil’s advocate—a person whose job is to question and criticize the group’s logic. While this approach can prolong group discussions, irritate the group, and be uncomfortable, the decisions that groups ultimately reach are usually more accurate and more solidly grounded than they otherwise would be.

For individuals, the trick is to be your own devil’s advocate: to think through how your favored conclusions might be misguided; to ask yourself how you might be wrong, or how things might turn out differently from what you expect. It helps to try practicing what the psychologist Charles Lord calls “considering the opposite.” To do this, I often imagine myself in a future in which I have turned out to be wrong in a decision, and then consider what the likeliest path was that led to my failure. And lastly: Seek advice. Other people may have their own misbeliefs, but a discussion can often be sufficient to rid a serious person of his or her most egregious misconceptions.

CIVICS FOR ENLIGHTENED DUMMIES


In an edition of “Lie Witness News” last January, Jimmy Kimmel’s cameras decamped to the streets of Los Angeles the day before President Barack Obama was scheduled to give his annual State of the Union address. Interviewees were asked about John Boehner’s nap during the speech and the moment at the end when Obama faked a heart attack. Reviews of the fictitious speech ranged from “awesome” to “powerful” to just “all right.” As usual, the producers had no trouble finding people who were willing to hold forth on events they couldn’t know anything about.

American comedians like Kimmel and Jay Leno have a long history of lampooning their countrymen’s ignorance, and American scolds have a long history of lamenting it. Every few years, for at least the past century, various groups of serious-minded citizens have conducted studies of civic literacy—asking members of the public about the nation’s history and governance—and held up the results as cause for grave concern over cultural decline and decay. In 1943, after a survey of 7,000 college freshmen found that only six percent could identify the original 13 colonies (with some believing that Abraham Lincoln, “our first president,” “emaciated the slaves”), the New York Times lamented the nation’s “appallingly ignorant” youth. In 2002, after a national test of fourth, eighth, and 12th graders produced similar results, the Weekly Standard pronounced America’s students “dumb as rocks.”

In 2008, the Intercollegiate Studies Institute surveyed 2,508 Americans and found that 20 percent of them think the electoral college “trains those aspiring for higher political office” or “was established to supervise the first televised presidential debates.” Alarms were again raised about the decline of civic literacy. Ironically, as Stanford historian Sam Wineburg has written, people who lament America’s worsening ignorance of its own history are themselves often blind to how many before them have made the exact same lament; a look back suggests not a falling off from some baseline of American greatness, but a fairly constant level of clumsiness with the facts.

The impulse to worry over all these flubbed answers does make a certain amount of sense given that the subject is civics. “The questions that stumped so many students,” lamented Secretary of Education Rod Paige after a 2001 test, “involve the most fundamental concepts of our democracy, our growth as a nation, and our role in the world.” One implicit, shame-faced question seems to be: What would the Founding Fathers think of these benighted descendants?

But I believe we already know what the Founding Fathers would think. As good citizens of the Enlightenment, they valued recognizing the limits of one’s knowledge at least as much as they valued retaining a bunch of facts. Thomas Jefferson, lamenting the quality of political journalism in his day, once observed that a person who avoided newspapers would be better informed than a daily reader, in that someone “who knows nothing is closer to the truth than he whose mind is filled with falsehoods and errors.” Benjamin Franklin wrote that “a learned blockhead is a greater blockhead than an ignorant one.” Another quote sometimes attributed to Franklin has it that “the doorstep to the temple of wisdom is a knowledge of our own ignorance.”

The built-in features of our brains, and the life experiences we accumulate, do in fact fill our heads with immense knowledge; what they do not confer is insight into the dimensions of our ignorance. As such, wisdom may not involve facts and formulas so much as the ability to recognize when a limit has been reached. Stumbling through all our cognitive clutter just to recognize a true “I don’t know” may not constitute failure as much as it does an enviable success, a crucial signpost that shows us we are traveling in the right direction toward the truth.


For more on the science of society, and to support our work, sign up for our free email newsletters and subscribe to our bimonthly magazine. Digital editions are available in the App Store (iPad) and on Google Play (Android) and Zinio (Android, iPad, PC/MAC, iPhone, and Win8).
David Dunning
David Dunning is a professor of psychology at Cornell University. He holds a Ph.D. from Stanford University and a B.A. from Michigan State University, both in psychology.

Friday, October 17, 2014

How to Measure Metacognition - Stephen M. Fleming and Hakwan C. Lau

http://www.dreamforger.com/images/images/nick/gd/Metacognition.jpg

From Frontiers in Human Neuroscience, this is an interesting and geeky article on how we might begin to measure metacognition (the ability to recognize our own successful cognitive functioning).

Full Citation: 
Fleming SM and Lau HC. (2014, Jul 15). How to measure metacognition. Frontiers in Human Neuroscience; 8:443. doi: 10.3389/fnhum.2014.00443

How to measure metacognition


Stephen M. Fleming [1,2] and Hakwan C. Lau [3,4]
1. Department of Experimental Psychology, University of Oxford, Oxford, UK
2. Center for Neural Science, New York University, New York, NY, USA
3. Department of Psychology, Columbia University, New York, NY, USA
4. Department of Psychology, University of California, Los Angeles, Los Angeles, CA, USA
Abstract

The ability to recognize one's own successful cognitive processing, in e.g., perceptual or memory tasks, is often referred to as metacognition. How should we quantitatively measure such ability? Here we focus on a class of measures that assess the correspondence between trial-by-trial accuracy and one's own confidence. In general, for healthy subjects endowed with metacognitive sensitivity, when one is confident, one is more likely to be correct. Thus, the degree of association between accuracy and confidence can be taken as a quantitative measure of metacognition. However, many studies use a statistical correlation coefficient (e.g., Pearson's r) or its variant to assess this degree of association, and such measures are susceptible to undesirable influences from factors such as response biases. Here we review other measures based on signal detection theory and receiver operating characteristics (ROC) analysis that are “bias free,” and relate these quantities to the calibration and discrimination measures developed in the probability estimation literature. We go on to distinguish between the related concepts of metacognitive bias (a difference in subjective confidence despite basic task performance remaining constant), metacognitive sensitivity (how good one is at distinguishing between one's own correct and incorrect judgments) and metacognitive efficiency (a subject's level of metacognitive sensitivity given a certain level of task performance). Finally, we discuss how these three concepts pose interesting questions for the study of metacognition and conscious awareness.


Introduction


Early cognitive psychologists were interested in how well people could assess or monitor their own knowledge, and asking for confidence ratings was one of the mainstays of psychophysical analysis (Peirce and Jastrow, 1885). For example, Henmon (1911) summarized his results as follows: “While there is a positive correlation on the whole between degree of confidence and accuracy the degree of confidence is not a reliable index of accuracy.” This statement is largely supported by more recent research in the field of metacognition in a variety of domains from memory to perception and decision-making: subjects have some metacognitive sensitivity, but it is often subject to error (Nelson and Narens, 1990; Metcalfe and Shimamura, 1996). The determinants of metacognitive sensitivity is an active topic of investigation that has been reviewed at length elsewhere (e.g., Koriat, 2007; Fleming and Dolan, 2012). Here we are concerned with the best approach to measure metacognition, a topic on which there remains substantial confusion and heterogeneity of approach.


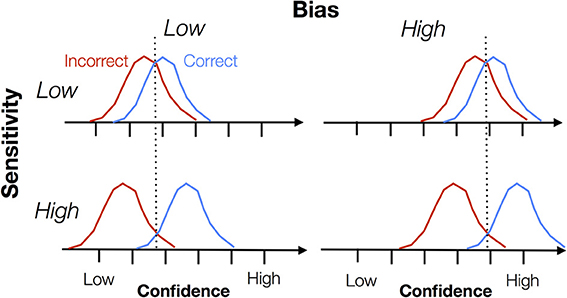
From the outset, it is important to distinguish two aspects, namely sensitivity and bias. Metacognitive sensitivity is also known as metacognitive accuracy, type 2 sensitivity, discrimination, reliability, or the confidence-accuracy correlation. Metacognitive bias is also known as type 2 bias, over- or underconfidence or calibration. In Figure 1 we illustrate the difference between these two constructs. Each panel shows a cartoon density of confidence ratings separately for correct and incorrect trials on an arbitrary task (e.g., a perceptual discrimination). Intuitively, when these distributions are well separated, the subject is able to discriminate good and bad task performance using the confidence scale, and can be assigned a high degree of metacognitive sensitivity. However, note that bias “rides on top of” any measure of sensitivity. A subject might have high overall confidence but poor metacognitive sensitivity if the correct/error distributions are not separable. Both sensitivity and bias are important features of metacognitive judgments, but they are often conflated when interpreting data. In this paper we outline behavioral measures that are able to separately quantify sensitivity and bias.
FIGURE 1
http://www.frontiersin.org/files/Articles/82285/fnhum-08-00443-HTML/image_m/fnhum-08-00443-g001.jpg
Figure 1. Schematic showing the theoretical dissociation between metacognitive sensitivity and bias. Each graph shows a hypothetical probability density of confidence ratings for correct and incorrect trials, with confidence increasing from left to right along each x-axis. Metacognitive sensitivity is the separation between the distributions—the extent to which confidence discriminates between correct and incorrect trials. Metacognitive bias is the overall level of confidence expressed, independent of whether the trial is correct or incorrect. Note that this is a cartoon schematic and we do not mean to imply any parametric form for these “Type 2” signal detection theoretic distributions. Indeed, as shown by Galvin et al. (2003), these distributions are unlikely to be Gaussian.

A second important feature of metacognitive measures is that sensitivity is often affected by task performance itself—in other words, the same individual will appear to have greater metacognitive sensitivity on an easy task compared to a hard task. In contrast, it is reasonable to assume that an individual might have a particular level of metacognitive efficiency in a domain such as memory or decision-making that is independent of different levels of task performance. Nelson (1984) emphasized this desirable property of a measure of metacognition when he wrote that “there should not be a built-in relation between [a measure of] feeling-of-knowing accuracy and overall recognition,” thus providing for the “logical independence of metacognitive ability… and objective memory ability” (Nelson, 1984; p. 111). The question is then how to distil a measure of metacognitive efficiency from behavioral data. We highlight recent progress on this issue.


We note there are a variety of methods for eliciting metacognitive judgments (e.g., wagering, scoring rules, confidence scales, awareness ratings) across different domains that have been discussed at length elsewhere (Keren, 1991; Hollard et al., 2010; Sandberg et al., 2010; Fleming and Dolan, 2012). Our focus here is on quantifying metacognition once a judgment has been elicited.


Measures of Metacognitive Sensitivity


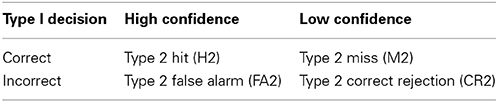
A useful starting point for all the measures of metacognitive sensitivity that follow is the 2 × 2 confidence-accuracy table (Table 1). This table simply counts the number of high confidence ratings assigned to correct and incorrect judgments, and similarly for low confidence ratings. Intuitively, above-chance metacognitive sensitivity is found when correct trials are endorsed with high confidence to a greater degree than incorrect trials1. Readers with a background in signal detection theory (SDT) will immediately see the connection between Table 1 and standard, “type 1” SDT (Green and Swets, 1966). In type 1 SDT, the relevant joint probability distribution is P(response, stimulus)—parameters of this distribution such as d′ are concerned with how effectively an organism can discriminate objective states of the world. In contrast, Table 1 has been dubbed the “type 2” SDT table (Clarke et al., 1959), as the confidence ratings are conditioned on the observer's responses (correct or incorrect), not on the objective state of the world. All measures of metacognitive sensitivity can be reduced to operations on this joint probability distribution P(confidence, accuracy) (see Mason, 2003, for a mathematical treatment).
TABLE 1
http://www.frontiersin.org/files/Articles/82285/fnhum-08-00443-HTML/image_m/fnhum-08-00443-t001.jpg
Table 1. Classification of responses within type 2 signal detection theory.
In the discussion that follows we assume that stimulus strength or task difficulty is held roughly constant. In such a design, fluctuations in accuracy and confidence can be attributed to noise internal to the observer, rather than external changes in signal strength. This “method of constant stimuli” is appropriate for fitting signal detection theoretic models, but it also rules out other potentially interesting experimental questions, such as how behavior and confidence change with stimulus strength. In the section Psychometric Function Measures we discuss approaches to measuring metacognitive sensitivity in designs such as these.

Correlation Measures


The simplest measure of association between the rows and columns of Table 1 is the phi (ϕ) correlation. In essence, phi is the standard Pearson r correlation between accuracy and confidence over trials. That is, if we code correct responses as 1's, and incorrect responses as 0's, accuracy over trials forms a vector, e.g., [0 1 1 0 0 1]. And if we code high confidence as 1, and low confidence as 0, we can likewise form a vector of the same length (number of trials). The Pearson r correlation between these two vectors defines the “phi” coefficient. A related and very common measure of metacognitive sensitivity, at least in the memory literature, is the Goodman–Kruskall gamma coefficient, G (Goodman and Kruskal, 1954; Nelson, 1984). In a classic paper, Nelson (1984) advocated G as a measure of metacognitive sensitivity that does not make the distributional assumptions of SDT.


G can be easily expanded to handle designs in which confidence is made using a rating scale rather than a dichotomous high/low design (Gonzalez and Nelson, 1996). Though popular, as measures of metacognitive sensitivity both phi and gamma correlations have a number of problems. The most prominent is the fact that both can be “contaminated” by metacognitive bias. That is, for subjects with a high or low tendency to give high confidence ratings overall, their phi correlation will be altered (Nelson, 1984)2. Intuitively one can consider the extreme cases where subjects perform a task near threshold (i.e., between ceiling and chance performance), but rate every trial as low confidence, not because of a lack of ability to introspect, but because of an overly shy or humble personality. In such a case, the correspondence between confidence and accuracy is constrained by bias. In an extensive simulation study, Masson and Rotello (2009) showed that G was similarly sensitive to the tendency to use higher or lower confidence ratings (bias), and that this may lead to erroneous conclusions, such as interpreting a difference in G between groups as reflecting a true underlying difference in metacognitive sensitivity despite possible differences in bias.
 

Type 2 d′


A standard way to remove the influence of bias in an estimation of sensitivity is to apply SDT (Green and Swets, 1966). In the case of type 1 detection tasks, overall percentage correct is “contaminated” by the subject's bias, i.e., the propensity to say “yes” overall. To remove this influence of bias, researchers often estimate d′ based on the hit rate and false alarm rate, which (assuming equal-variance Gaussian distributions for internal signal strength) is mathematically independent of bias. That is, given a constant underlying sensitivity to detect the signal, estimated d′ will be constant given different biases.


There have been several evaluations of this approach to characterize metacognitive sensitivity (Clarke et al., 1959; Lachman et al., 1979; Ferrell and McGoey, 1980; Nelson, 1984; Kunimoto et al., 2001; Higham, 2007; Higham et al., 2009), where type 2 hit rate is defined as the proportion of trials in which subjects reported high confidence given their responses were correct (H2 in Table 1), and type 2 false alarm rate is defined as the proportion of trials in which subjects reported high confidence given their responses were incorrect (FA2 in Table 1). Type 2 d′ = z(H2) − z(FA2), where z is the inverse of the cumulative normal distribution function3. Theoretically, then, by using standard SDT, type 2 d′ is argued to be independent from metacognitive bias (the overall propensity to give high confidence responses).


However, type 2 d′ turns out to be problematic because SDT assumes that the distribution of internal signals for “correct” and “incorrect” trials are Gaussian with equal variances. While this assumption is usually more or less acceptable at the type 1 level (especially for 2-alternative forced-choice tasks), it is highly problematic for type 2 analysis. Galvin et al. (2003) showed that these distributions are of different variance and highly non-Gaussian if the equal variance assumption holds at the type 1 level. Using simulation data, Evans and Azzopardi (2007) showed that this leads to the type 2 d′ measure proposed by Kunimoto et al. (2001) being confounded by changes in metacognitive bias.


Type 2 ROC Analysis


Because the standard parametric signal detection approach is problematic for type 2 analysis, one solution is to apply a non-parametric analysis that is free from the equal-variance Gaussian assumption. In type 1 SDT this is standardly achieved via ROC (receiver operating characteristic) analysis, in which data are obtained from multiple response criteria. For example, if the payoffs for making a hit and false alarm are systematically altered, it is possible to systematically induce more conservative or liberal criteria. For each criterion, hit rate and false alarm rate can be calculated. These are plotted as individual points on the ROC plot—hit rate is plotted on the vertical axis and false alarm rate on the horizontal axis. With multiple criteria we have multiple points, and the curve that passes through these different points is the ROC curve. If the area under the ROC is 0.5, performance is at chance. Higher area under ROC (AUROC) indicates higher sensitivity.


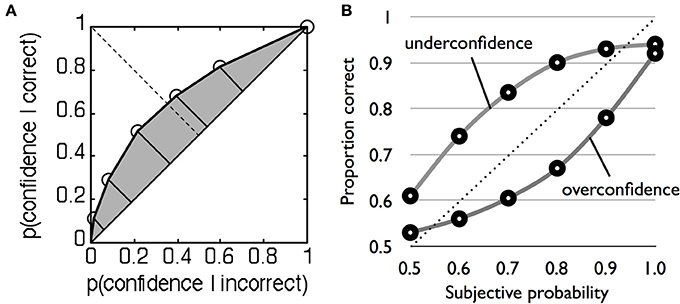
Because this method is non-parametric, it does not depend on rigid assumptions about the nature of the underlying distributions and can similarly be applied to type 2 data. Recall that type 2 hit rate is simply the proportion of high confidence trials when the subject is correct, and type 2 false alarm rate is the proportion of high confidence trials when the subject is incorrect (Table 1). For two levels of confidence there is thus one criterion, and one pair of type 2 hit and false alarm rates. However, with multiple confidence ratings it is possible to construct the full type 2 ROC by treating each confidence level as a criterion that separates high from low confidence (Clarke et al., 1959; Galvin et al., 2003; Benjamin and Diaz, 2008). For instance, we start with a liberal criterion that assigns low confidence = 1 and high confidence = 2–4, then a higher criterion that assigns low confidence = 1 and 2 and high confidence = 3 and 4, and so on. For each split of the data, hit and false alarm rate pairs are calculated and plotted to obtain a type 2 ROC curve (Figure 2A). The area under the type 2 ROC curve (AUROC2) can then be used as a measure of metacognitive sensitivity (in the Supplementary Material we provide Matlab code for calculating AUROC2 from rating data). This method is more advantageous than the gamma and phi correlations because it is bias-free (i.e., it is theoretically uninfluenced by the overall propensity of the subject to say high confidence) and in contrast to type 2 d′ does not make parametric assumptions that are known to be false.
FIGURE 2
http://www.frontiersin.org/files/Articles/82285/fnhum-08-00443-HTML/image_m/fnhum-08-00443-g002.jpg
Figure 2. (A) Example type 2 ROC function for a single subject. Each point plots the type 2 false alarm rate on the x-axis against the type 2 hit rate on the y-axis for a given confidence criterion. The shaded area under the curve indexes metacognitive sensitivity. (B) Example underconfident and overconfident probability calibration curves, modified after Harvey (1997).

In summary, therefore, despite their intuitive appeal, simple measures of association such as the phi correlation and gamma do not separate metacognitive sensitivity from bias. Non-parametric methods such as AUROC2 provide bias-free measures of sensitivity. However, a further complication when studying metacognitive sensitivity is that the measures reviewed above are also affected by task performance. For instance, Galvin et al. (2003) showed mathematically that AUROC2 is affected by both type 1 d′ and type 1 criterion placement, a conclusion supported by experimental manipulation (Higham et al., 2009). In other words, a change in task performance is expected, a priori, to lead to changes in AUROC2, despite the subject's endogenous metacognitive “efficiency” remaining unchanged. One approach to dealing with this confound is to use psychophysical techniques to control for differences in performance and then calculate AUROC2 (e.g., Fleming et al., 2010). An alternative approach is to explicitly model the connection between performance and metacognition.


Model-Based Approaches


The recently developed meta-d′ measure (Maniscalco and Lau, 2012, 2014) exploits the fact that given Gaussian variance assumptions at the type 1 level, the shapes of the type 2 distributions are known even if they are not themselves Gaussian (Galvin et al., 2003). Theoretically therefore, ideal, maximum type 2 performance is constrained by one's type 1 performance. Intuitively, one can again consider the extreme cases. Imagine a subject is performing a two-choice discrimination task completely at chance. Half of their trials are correct and half are incorrect due to chance responding despite zero type 1 sensitivity. To introspectively distinguish between correct and incorrect trials would be impossible, because the correct trials are flukes. Thus, when type 1 sensitivity is zero, type 2 sensitivity (metacognitive sensitivity) should also be so. This dependency places strong constraints on a measure of metacognitive sensitivity.


Specifically, given a particular type 1 variance structure and bias, the form of the type 2 ROC is completely determined (Galvin et al., 2003). We can thus create a family of type 2 ROC curves, each of which will correspond to an underlying type 1 sensitivity assuming that the subject is metacognitively ideal (i.e., has maximal type 2 sensitivity given a certain type 1 sensitivity). Because such a family of type 2 ROC curves are all non-overlapping (Galvin et al., 2003), we can determine the curve from this family with just a single point, i.e., a single criterion. With this, we can obtain, given the subject's actual type 2 performance data, the underlying type 1 sensitivity that we expect if the subject is ideal is placing their confidence ratings. We label the underlying type 1 sensitivity of this ideal observer meta-d'. Because meta-d' is in units of type 1 d′, we can think of it as the sensory evidence available for metacognition in signal-to-noise ratio units, just as type 1 d′ is the sensory evidence available for decision-making in signal-to-noise ratio units. Among currently available methods, we think meta-d′ is the best measure of metacognitive sensitivity, and it is quickly gaining popularity (e.g., Baird et al., 2013; Charles et al., 2013; Lee et al., 2013; McCurdy et al., 2013). Barrett et al. (2013) have conducted extensive normative tests of meta-d′, finding that it is robust to changes in bias and that it recovers simulated changes in metacognitive sensitivity (see also Maniscalco and Lau, 2014). Matlab code for fitting meta-d′ to rating data is available at http://www.columbia.edu/~bsm2105/type2sdt/.


One major advantage of meta-d′ over AUROC2 is its ease of interpretation and its elegant control over the influence of performance on metacognitive sensitivity. Specifically, because meta-d′ is in the same units as (type 1) d′, the two can be directly compared. Therefore, for a metacognitively ideal observer (a person who is rating confidence using the maximum possible metacognitive sensitivity), meta-d′ should equal d′. If meta-d′ < d′, metacognitive sensitivity is suboptimal within the SDT framework. We can therefore define metacognitive efficiency as the value of meta-d′ relative to d′, or meta-d′/d′. A meta-d′/d′ value of 1 indicates a theoretically ideal value of metacognitive efficiency. A value of 0.7 would indicate 70% metacognitive efficiency (30% of the sensory evidence available for the decision is lost when making metacognitive judgments), and so on. A closely related measure is the difference between meta-d′ and d′, i.e., meta-d′ − d′ (Rounis et al., 2010). One practical reason for using meta-d′ − d′ rather than meta-d′/d′ is that the latter is a ratio, and when the denominator (d′) is small, meta-d′/d′ can give rather extreme values which may undermine power in a group statistical analysis. However, this problem can also be addressed by taking log of meta- d′/d′, as is often done to correct for the non-normality of ratio measures (Howell, 2009). Toward the end of this article we explore the implications of this metacognitive efficiency construct for a psychology of metacognition.


The meta-d′ approach is based on an ideal observer model of the link between type 1 and type 2 SDT, using this as a benchmark against which to compare subjects' metacognitive efficiency. However, meta-d′ is unable to discriminate between different causes of a change in metacognitive efficiency. In particular, like standard SDT, meta-d′ is unable to dissociate trial-to-trial variability in the placement of confidence criteria from additional noise in the evidence used to make the confidence rating—both manifest as a decrease in metacognitive efficiency.


A similar bias-free approach to modeling metacognitive accuracy is the “Stochastic Detection and Retrieval Model” (SDRM) introduced by Jang et al. (2012). The SDRM not only measures metacognitive accuracy, but is also able to model different potential causes of metacognitive inaccuracy. The core of the model assumes two samplings of “evidence” per stimulus, one leading to a first-order behavior, such as memory retrieval, and the other leading to a confidence rating. These samples are distinct but drawn from a bivariate distribution with correlation parameter ρ. This variable correlation naturally accounts for dissociations between confidence and accuracy. For instance, if the samples are highly correlated, the subject will tend to be confident when behavioral performance is high, and less confident when behavioral performance is low. The SDRM additionally models noise in the confidence rating process itself through variability in the setting of confidence criteria from trial to trial. SDRM was originally developed to account for confidence in free recall involving a single class of items, but it can be naturally extended to two choice cases such as perceptual or mnemonic decisions. By modeling these two separate sources of variability, SDRM is able to unpack potential causes of a decrease in metacognitive efficiency. However, SDRM requires considerable interpretation of parameter fits to draw conclusions about underlying metacognitive processes, and meta-d′ may prove simpler to calculate and work with for many empirical applications.


Metacognitive Bias


Metacognitive bias is the tendency to give high confidence ratings, all else being equal. The simplest of such measures is the percentage of high confidence trials (i.e., the marginal proportion of high confidence judgments in Table 1, averaging over correct and incorrect trials), or the average confidence rating over trials. In standard type 1 SDT, a more liberal metacognitive bias corresponds to squeezing the flanking confidence-rating criteria toward the central decision criterion such that more area under both stimulus distributions falls beyond the “high confidence” criteria.


A more liberal metacognitive bias leads to different patterns of responding depending on how confidence is elicited. If confidence is elicited secondary to a decision about options “A” or “B,” squeezing the confidence criteria will lead to an overall increase in confidence, regardless of previous response. However, confidence is often elicited alongside the decision itself, using a scale such as 1 = sure “A” to 6 = sure “B,” where ratings 3 and 4 indicate low confidence “A” and “B,” respectively. A more liberal metacognitive bias in this case would lead to an increased use of the extremes of the scale (1 and 6) and a decreased use of the middle of the scale (3 and 4).


Psychometric Function Measures


The methods for measuring metacognitive sensitivity we have discussed above assume data is obtained using a constant level of task difficulty or stimulus strength, equivalent to obtaining a measure of d′ in standard psychophysics. If a continuous range of stimulus difficulties are available, such as when a full psychometric function is estimated, it is of course possible to apply the same methods to each level of stimulus strength independently. An alternative approach is to compute an aggregate measure of metacognitive sensitivity as the difference in slope between psychometric functions constructed from high and low confidence trials (e.g., De Martino et al., 2013; de Gardelle and Mamassian, 2014). The extent to which the slope becomes steeper (more accurate) under high compared to low confidence is a measure of metacognitive sensitivity. However, this method may not be bias-free, or account for individual differences in task performance, as discussed above.


Discrepancy Measures


We close this section by pointing out that some researchers have used “one-shot” discrepancy measures to quantify metacognition. For instance, if we ask someone how good their memory is on a scale of 1–10, we obtain a rating that we can then compare to memory performance on a variety of tasks. This discrepancy score approach is often used in the clinical literature (e.g., Schmitz et al., 2006) and in social psychology (e.g., Kruger and Dunning, 1999) to quantify metacognitive skill or “insight.” It is hopefully clear from the preceding sections that if one only has access to a single rating of performance, it is not possible to tease apart bias from sensitivity, nor measure efficiency. To continue with the memory example, a large discrepancy score may be due to a reluctance to rate oneself as performing poorly (metacognitive bias), or a true blindness to one's memory performance (metacognitive sensitivity). In contrast, by collecting trial-by-trial measures of performance and metacognitive judgments we can build up a picture of an individual's bias, sensitivity and efficiency in a particular domain.


Judgments of Probability


Metacognitive confidence can be formalized as a probability judgment directed toward one's own actions—the probability of a previous judgment being correct. There is a rich literature on the correspondence between subjective judgments of probability and the reality to which those judgments correspond. For example, a weather forecaster may make several predictions of the chance of rain throughout the year; if the average prediction (e.g., 60%) ends up matching the frequency of rainy days in the long run we can say that the forecaster is well calibrated. In this framework metacognition has a normative interpretation as the accuracy of a probability judgment about one's own performance. We do not aim to cover the literature on probability judgments here; instead we refer the reader to several comprehensive reviews (Lichtenstein et al., 1982; Keren, 1991; Harvey, 1997; Moore and Healy, 2008). Instead we highlight some developments in the judgment and decision-making literature that directly bear on the measurement of metacognition.


There are two general classes of probability judgment problem. Discrete cases refer to probabilities assigned to particular statements, such as “the correct answer is A” or “it will rain tomorrow.” Continuous cases are where the assessor provides a confidence interval or some other indication of their uncertainty in a quantity such as the distance from London to Manchester. While the accuracy of continuous judgments is also of interest, our focus here is on discrete judgments, as they provide the clearest connection to the metacognition measures reviewed above. For example, in a 2AFC task with stimulus class d and response a, an ideal observer should base their confidence on the quantity P(d = a).


An advantage of couching metacognitive judgments in a probability framework is that a meaningful measure of bias can be elicited. In other words, while a confidence rating of “4” does not mean much outside of the context of the experiment, a probability rating of 0.7 can be checked against the objective likelihood of occurrence of the event in the environment; i.e., the probability of being correct for a given confidence level. Moreover, probability judgments can be compared against quantities derived from probabilistic models of confidence (e.g., Kepecs and Mainen, 2012).


Quantifying the Accuracy of Probability Judgments


The judgment and decision-making literature has independently developed indices of probability accuracy similar to G and meta- d′ in the metacognition literature. For example, following Harvey (1997), a “probability score” (PS) is the squared difference between the probability rating f and its actual occurrence c (where c = 1 or 0 for binary events, such as correct or incorrect judgments):


PS=(f−c)2


The mean value of the PS averaged across estimates is known as the Brier score (Brier, 1950). As the PS is an “error” score, a lower value of PS is better. The Brier score is analogous to the phi coefficient discussed above.


The decomposition of the Brier score into its component parts may be of particular interest to metacognition researchers. Particularly, one can decompose the Brier score into the following components (Murphy, 1973):


PS = O + C −R

where O is the “outcome index” and reflects the variance of the outcome event c: O = c(1 − c); C is “calibration,” the goodness of fit between probability assessments and the corresponding proportion of correct responses; and R is “resolution,” the variance of the probability assessments. Note that in studies of metacognitive confidence in decision-making, memory, etc., the outcome event is simply the performance of the subject. In other words, when performance is near chance, the variance of the outcomes—corrects and errors—is maximal, and O will be high. In contrast, when performance is near ceiling, O is low. This decomposition therefore echoes the SDT-based analysis discussed above, and accordingly both reach the same conclusion: simple correlation measures between probabilities/confidence and outcomes/performance are themselves influenced by task performance. Just as efforts have been made to correct measures of metacognitive sensitivity for differences in performance and bias, similar concerns led to the development of bias-free measures of discrimination. In particular, Yaniv et al. (1991) describe an “adjusted normalized discrimination index” (ANDI) that achieves such control.


Calibration (C) is defined as:


C=1N∑j=1JNj(fj−cj¯¯¯ )2


where j indexes each probability category. Calibration quantifies the discrepancy between the mean performance level in a category (e.g., 60%) and its associated rating (e.g., 80%), with a lower discrepancy giving a better PS. A calibration curve is constructed by plotting the relative frequency of correct answers in each probability judgment category (e.g., 50–60%) against the mean probability rating for the category (e.g., 55%) (Figure 2B). A typical finding is that observers are overconfident (Lichtenstein et al., 1982)—probability judgments are greater than mean % correct.


Resolution is a measure of the variance of the probability assessments, measuring the extent to which correct and incorrect answers are assigned to different probability categories:


R=1N∑j=1JNj(cj¯¯¯ −c¯ )2


As R is subtracted from the other terms in the PS, a larger variance is better, reflecting the observer's ability to place correct and incorrect judgments in distinct probability categories.


Both calibration and resolution contribute to the overall “accuracy” of probability judgments. To illustrate this, consider the following contrived example. In a general knowledge task, a subject rates each correct judgment as 90% likely to be correct, and each error as 80% likely to be correct. Her objective mean performance level is 60%. She is poorly calibrated, in the sense that the mean subjective probability of being correct outstrips her actual performance. But she displays good resolution for discriminating correct from incorrect trials using distinct levels of the probability scale (although this resolution could be even higher if she chose even more diverse ratings). This example raises important questions as to the psychological processes that permit metacognitive discrimination of internal states (e.g., resolution, or sensitivity) and the mapping of these discriminations onto a probability or confidence scale (calibration; e.g., Ferrell and McGoey, 1980). The learning of this mapping, and how it may lead to changes in metacognition, has received relatively little attention.


Implications of Bias, Sensitivity, and Efficiency for a Psychology of Metacognition


The psychological study of metacognition has been interested in elucidating the determinants and impact of metacognitive sensitivity. For instance, in a classic example, judgments of learning (JOLs) show better sensitivity when the delay between initial learning and JOL is increased (Nelson and Dunlosky, 1991), presumably due to delayed JOLs recruiting relevant diagnostic information from long-term memory. However, many of these “classic” findings in the metacognition rely on measures such as G (Rhodes and Tauber, 2011) that may be confounded by bias and performance effects (although see Jang et al., 2012). We strongly urge the application of bias-free measures of metacognitive sensitivity reviewed above in future studies.


More generally, we believe it is important to distinguish between metacognitive sensitivity and efficiency. To recap, metacognitive sensitivity is the ability to discriminate correct from incorrect judgments; signal detection theoretic analysis shows that metacognitive sensitivity scales with task performance. In contrast, metacognitive efficiency is measured relative to a particular performance level. Efficiency measures have several possible applications. First, we may want to compare metacognitive efficiency across domains in which it is not possible to match performance levels. For instance, it is possible to quantify metacognitive efficiency on visual and memory tasks to elucidate their respective neural correlates (Baird et al., 2013; McCurdy et al., 2013). Second, it is of interest to determine whether different subject groups, such as patients and controls (David et al., 2012) or older vs. younger adults (Souchay et al., 2000), exhibit differential metacognitive efficiency after taking into account differences in task performance. For example, Weil et al. (2013) showed that metacognitive efficiency increases during adolescence, consistent with the maturation of prefrontal regions thought to underpin metacognition (Fleming and Dolan, 2012). Finally, it will be of particular interest to compare metacognitive efficiency across different animal species. Several studies have established the presence of metacognitive sensitivity in some non-human animals (Hampton, 2001; Kornell et al., 2007; Middlebrooks and Sommer, 2011; Kepecs and Mainen, 2012). However, it is unknown whether other species such as macaque monkeys have levels of metacognitive efficiency similar to those seen in humans.


Finally, the influence of performance, or skill, on efficiency itself is of interest. In a highly cited paper, Kruger and Dunning (1999) report a series of experiments in which the worst-performing subjects on a variety of tests showed a bigger discrepancy between actual performance and a one-shot rating than the better performers. The authors concluded that “those with limited knowledge in a domain suffer a dual burden: Not only do they reach mistaken conclusions and make regrettable errors, but their incompetence robs them of the ability to realize it” (p. 1132). Notably the Dunning–Kruger effect has two distinct interpretations in terms of sensitivity and efficiency. On the one hand the effect is a direct consequence of metacognitive sensitivity being determined by type 1 d′. In other words, it would be strange (based on the ideal observer model) if worse performing subjects didn't make noisier ratings. On the other hand, it is possible that skill in a domain and metacognitive efficiency share resources (Dunning and Kruger's preferred interpretation), leading to a non-linear relationship between d′ and metacognitive sensitivity. As discussed above, one-shot ratings are unable to disentangle bias, sensitivity and efficiency. Instead, by collecting trial-by-trial metacognitive judgments and calculating efficiency, it may be possible to ask whether efficiency itself is reduced in subjects with poorer skill.


Implications of Bias, Sensitivity, and Efficiency for Studies of Conscious Awareness


There has been a recent interest in interpreting metacognitive measures as reflecting conscious awareness or subjective (often visual) phenomenological experience, and in this final section we discuss some caveats associated with these thorny issues. As early as Peirce and Jastrow (1885) it has been suggested that a subject's confidence can be used to indicate level of sensory awareness. Namely, if in making a perceptual judgment, a subject has zero confidence and feels that a pure guess has been made, then presumably the subject is not aware of sensory information driving the decision. If their judgment turns out to be correct, it would seem likely to be a fluke or due to unconscious processing.


However, confidence is typically correlated with task accuracy (type 1 d′)—indeed, this is the essence of metacognitive sensitivity. It has been argued that type 1 d′ itself should not be taken as a measure of awareness because unconscious processing may also drive type 1 d′ (Lau, 2008), as demonstrated in clinical cases such as blindsight (Weiskrantz et al., 1974). Lau (2008) gives further arguments as to why type 1 d′ is a poor measure of subjective awareness and argues that it should be treated as a potential confound. In other words, because type 1 d′ does not necessarily reflect awareness, in measuring awareness we should compare conditions where type 1 d′ is matched or otherwise controlled for. Importantly, to match type 1 d′, it is difficult to focus the analysis at a single-trial level, because d′ is a property of a task condition or group of trials. Therefore, Lau and Passingham (2006) created task conditions that were matched for type 1 d′ but differed in level of subjective awareness, permitting an analysis of neural activity correlated with visual awareness but not performance. Essentially, such differences between conditions reflect a difference in metacognitive bias despite type 1 d′ being matched.


In contrast, other studies have focused on metacognitive sensitivity, rather than bias, as a relevant measure of awareness. For instance, Kolb and Braun (1995) used binocular presentation and motion patterns to create stimuli in which subjects had positive type 1 d′ (in a localization task), but near-zero metacognitive sensitivity. Although this finding has proven difficult to replicate (Morgan and Mason, 1997), here we focus on the conceptual basis of their argument. The notion of taking a lack of metacognitive sensitivity as reflecting lack of awareness has also been discussed in the literature on implicit learning (Dienes, 2008), and is intuitively appealing. Lack of metacognitive sensitivity indicates that the subject has no ability to introspect upon the effectiveness of their performance. One plausible reason for this lack of ability is an absence of conscious experience on which the subject can introspect.


However, there is another possibility. Metacognitive sensitivity is calculated with reference to the external world (whether a judgment is objectively correct or incorrect), not the subject's experience, which is unknown to the experimenter. Thus, while low metacognitive sensitivity could be due to an absence of conscious experience, it could also be due to hallucinations, such that the subject vividly sees a false target and thus generates an incorrect type 1 response. Because of the vividness of the hallucination, the subject may reasonably express high confidence (a type 2 false alarm, from the point of view of the experimenter). In the case of hallucinations, the conscious experience does not correspond to objects in the real world, but it is a conscious experience all the same. Thus, low metacognitive sensitivity cannot be taken unequivocally to mean lack of conscious experience.


That said, we acknowledge the close relationship between metacognitive sensitivity and awareness in standard laboratory experiments in the absence of psychosis. Intuitively, metacognitive sensitivity is what gives confidence ratings their meaning. Confidence or bias fluctuates across individual trials (a single trial might be rated as “seen” or highly confident), whereas metacognitive sensitivity is a property of the individual, or at least a particular condition in the experiment. High confidence is only meaningfully interpretable as successful recognition of one's own effective processing when it can be shown that there is some reasonable level of metacognitive sensitivity; i.e., that confidence ratings were not given randomly. For instance, Schwiedrzik et al. (2011) used this logic to argue that differences in metacognitive bias reflected genuine differences in awareness, because metacognitive sensitivity was positive and unchanged in their experiment.


We note that criticisms also apply to using metacognitive bias to index awareness. In all cases, we would need to make sure that type 1 d′ is not a confound, and that the confidence level expressed is solely due to introspection of the conscious experience in question. Thus, the strongest argument for preferring metacognitive bias rather than metacognitive sensitivity as a measure of awareness is a conceptual one. Metacognitive sensitivity measures the ability of the subject to introspect, not what or how much conscious experience is being introspected upon on any given trial. For instance, in what is sometimes called type 2 blindsight, patients may develop a “hunch” that the stimulus is presented, without acknowledging the existence of a corresponding visual conscious experience. Such a hunch may drive above-chance metacognitive sensitivity (Persaud et al., 2011). More generally, it is unfortunate that researchers often prefer sensitivity or sensitivity measures simply because they are “bias free.” This advantage is only relevant when we have good reasons to want to exclude the influence of bias! Otherwise, bias and sensitivity measures are just different measures. This is true for both type 1 and type 2 analyses. Instead it might be useful to think of metacognitive sensitivity as a background against which awareness reports should be referenced. Metacognitive sensitivity indexes the amount we can trust the subject to tell us something about the objective features of the stimulus. But lack of trust does not immediately rule out an idiosyncratic conscious experience divorced from features of the world proscribed by the experimenter.


Conclusions


Here we have reviewed measures of metacognitive sensitivity, and pointed out that bias is a confounding factor for popular measures of association such as gamma and phi. We point out that there are alternative measures available based on SDT and ROC analysis that are bias-free, and we relate these quantities to the calibration and resolution measures developed in the probability estimation literature. We strongly urge the application of the bias-free measures of metacognitive sensitivity reviewed above in future studies of metacognition. We distinguished between the related concepts of metacognitive bias (a difference in subjective confidence despite basic task performance remaining constant), metacognitive sensitivity (how good one is at distinguishing between one's own correct and incorrect judgments) and metacognitive efficiency (a subject's level of metacognition given a certain basic task performance or signal processing capacity). Finally, we discussed how these three concepts pose interesting questions for future studies of metacognition, and provide some cautionary warnings for directly equating metacognitive sensitivity with awareness. Instead, we advocate a more traditional approach that takes metacognitive bias as reflecting levels of awareness and metacognitive sensitivity as a background against which other measures should be referenced.

Conflict of Interest Statement


The Editor Dr. Harriet Brown declares that despite having previously collaborated with the author Dr. Klaas Stephan the review process was handled objectively. The authors declare that the research was conducted in the absence of any commercial or financial relationships that could be construed as a potential conflict of interest.

Acknowledgments


Stephen M. Fleming is supported by a Sir Henry Wellcome Fellowship from the Wellcome Trust (WT096185). We thank Brian Maniscalco for helpful discussions.

Supplementary Material


The Supplementary Material for this article can be found online at: http://www.frontiersin.org/journal/10.3389/fnhum.2014.00443/abstract

Footnotes

1. ^These ratings may be elicited either prospectively or retrospectively.
2. ^Another way of stating this is that phi is “margin sensitive”—the value of phi is affected by the marginal counts of Table 1 (the row and column sums) that describe an individual's task performance and bias.
3. ^Kunimoto and colleagues labeled their type 2 d′ measure a′.
References at the Frontiers site