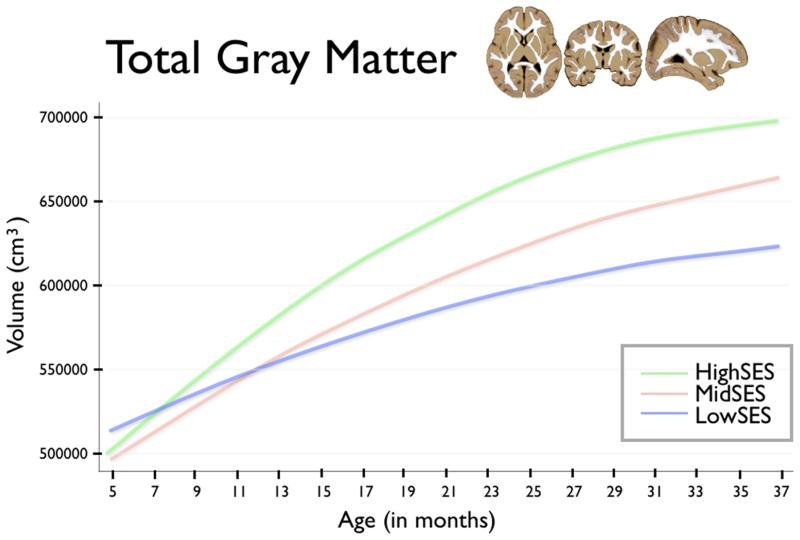
From Frontiers in Neuroscience, this interesting article looks at the body of research investigating associations between socioeconomic status (SES) and brain development in children. Previous studies have found significant links between low SES and changes (deficits) in brain structure, especially in areas related to memory, executive control, and emotion. Brito and Noble review the studies examining links between structural brain development and SES disparities of the magnitude typically found in developing countries.
[The image above is from another study on the same basic topic.]
As a kind of short-hand summary of the article, the researchers found six key concepts:
KEY CONCEPT 1. Socioeconomic status (SES)Even though this article looks at income disparity in the developing countries, the United States has some of the greatest income disparities on the planet. You can bet this is having the same impact on our poorest children as they found in their review of the literature.
Refers to an individual's access to economic and social resources, as well as the benefits and social standing that come from these resources. Most often measured by educational attainment, income, or occupation.
KEY CONCEPT 2. Poverty
Comparison of a household's income with a threshold level of income that varies with family size and inflation. Households below the poverty threshold are considered “poor.” Households above this threshold are considered “not poor” even if the amount of money between “poor” and “not poor” is diminutive. Poverty guideline for a family of four in 2014 is $23,850.
KEY CONCEPT 3. Income-to-Needs
The ratio of total family income divided by the federal poverty level for a family of that size, in the year data were collected. A family living at the poverty line would have an income-to-needs of ratio of 1. In 2012, 20.4 million people reported an income below 50% of their poverty threshold, including 7.1 million children under the age of 18.
KEY CONCEPT 4. Cortical thickness
Defined in neuroimaging studies as the shortest distance between the white matter surface and pial gray matter surface.
KEY CONCEPT 5. Cortical volumes
The most commonly used outcome in studies of socioeconomic disparities in brain structure. Cortical volume is actually a composite of cortical thickness and surface area, two genetically and phenotypically distinct morphometric properties of the brain.
KEY CONCEPT 6. Surface area
The area of exposed cortical surface or convex hull area (CHA) and the area of cortex hidden in sulci.
Full Citation:
Brito NH, and Noble KG. (2014, Sep 4). Socioeconomic status and structural brain development. Frontiers in Neuroscience; 8:276. doi: 10.3389/fnins.2014.00276
Socioeconomic status and structural brain development
Natalie H. Brito and Kimberly G. Noble
- Department of Pediatrics, Gertrude H. Sergievsky Center, Columbia University, New York, NY, USA
Abstract
Recent advances in neuroimaging methods have made accessible new ways of disentangling the complex interplay between genetic and environmental factors that influence structural brain development. In recent years, research investigating associations between socioeconomic status (SES) and brain development have found significant links between SES and changes in brain structure, especially in areas related to memory, executive control, and emotion. This review focuses on studies examining links between structural brain development and SES disparities of the magnitude typically found in developing countries. We highlight how highly correlated measures of SES are differentially related to structural changes within the brain.
Introduction
Human development does not occur within a vacuum. The environmental contexts and social connections a person experiences throughout his or her lifetime significantly impact the development of both cognitive and social skills. The incorporation of neuroscience into topics more commonly associated with the social sciences, such as culture or socioeconomic status (SES), has led to an increased understanding of the mechanisms that underlie development across the lifespan. However, more research is necessary to disentangle the complexities surrounding early environmental variation and neural development. This review highlights studies examining links between structural brain development and SES disparities of the magnitude typically found in developing countries. We do not include studies examining children who have experienced extreme forms of early adversity, such as institutionalization or severe abuse. We also limit this review to findings concerning socioeconomic disparities in brain structure, as opposed to brain function.
KEY CONCEPT 1. Socioeconomic status (SES)
Refers to an individual's access to economic and social resources, as well as the benefits and social standing that come from these resources. Most often measured by educational attainment, income, or occupation.
SES is a multidimensional construct, combining objective factors such as an individual's (or parent's) education, occupation, and income (McLoyd, 1998). Neighborhood SES is also often considered (Leventhal and Brooks-Gunn, 2000), as are subjective measures of social status (Adler et al., 2000). In 2012, 46.5 million people in the United States (15%) lived below the official poverty line (United States Census Bureau, 2012) and numerous studies have reported socioeconomic disparities profoundly affecting physical health, mental well-being, and cognitive development (Anderson and Armstead, 1995; Brooks-Gunn and Duncan, 1997; McLoyd, 1998; Evans, 2006). In turn, SES accounts for approximately 20% of the variance in childhood IQ (Gottfried et al., 2003) and it has been estimated that by age five, chronic poverty is associated with a 6- to 13-point IQ reduction (Brooks-Gunn and Duncan, 1997; Smith et al., 1997). Disparities in cognitive development outweigh disparities in physical health, possibly contributing to the propagation of poverty across generations (Duncan et al., 1998).
KEY CONCEPT 2. Poverty
Comparison of a household's income with a threshold level of income that varies with family size and inflation. Households below the poverty threshold are considered “poor.” Households above this threshold are considered “not poor” even if the amount of money between “poor” and “not poor” is diminutive. Poverty guideline for a family of four in 2014 is $23,850.
Evidence suggests multiple possible, and non-mutually-exclusive, explanations for these findings. Socioeconomically disadvantaged children tend to experience less linguistic, social, and cognitive stimulation from their caregivers and home environments than children from higher SES homes (Hart and Risley, 1995; Bradley et al., 2001; Bradley and Corwyn, 2002; Rowe and Goldin-Meadow, 2009). Additionally, individuals from lower SES homes report more stressful events during their lifetime, and the biological response to stressors has been hypothesized as one of the underlying mechanisms for health and cognitive disparities in relation to SES (Anderson and Armstead, 1995; Hackman and Farah, 2009; Noble et al., 2012a).
In turn, these experiential differences are likely to have relatively specific downstream effects on particular brain structures (see Figure 1 for one theoretical model). For example, disparities in the quantity and quality of linguistic stimulation in the home have been associated with developmental differences in language-supporting cortical regions in the left hemisphere (Kuhl et al., 2003; Conboy and Kuhl, 2007; Kuhl, 2007). In contrast, the experience of stress has important negative effects on the hippocampus (Buss et al., 2007; McEwen and Gianaros, 2010; Tottenham and Sheridan, 2010), the amygdala (McEwen and Gianaros, 2010; Tottenham and Sheridan, 2010), and areas of the prefrontal cortex (Liston et al., 2009; McEwen and Gianaros, 2010)—structures which are linked together anatomically and functionally (McEwen and Gianaros, 2010). As discussed below, different components of SES may differentially relate to these varying experiences, and thus may have varying associations with particular structures across the brain.FIGURE 1Figure 1. Hypothesized mechanisms by which SES operates to influence structural and functional brain development.
Measures of parental SES are often used as indicators of children's family or home conditions, but these distal measures may not fully account for children's experiences. For example, while a parent may be highly educated, unforeseen circumstances, such as a recession, may cause short- or long-term unemployment and inadequate income, leading to reduced resources and increased family stress experienced by the child. Studies examining an individual's own SES may more accurately represent the individual's current experience during adulthood, but may possibly discount the environmental experiences that shaped neural development as a child. Some studies have included measures of both childhood and adult SES (see Table 1), attempting to obtain a complete measure of SES development, but retrospective SES relies on the individual's memory of past events, and therefore may be biased. Overall, accurate and complete measures of SES are often difficult to obtain and these complications render it difficult to disentangle precise associations between specific socioeconomic indicators and outcomes of interest. Despite this, even approximate assessments of SES have, across multiple independent laboratories, been shown to predict clinically and statistically significant differences in brain structure and function, signifying the prominent association between environmental factors and brain development.TABLE 1
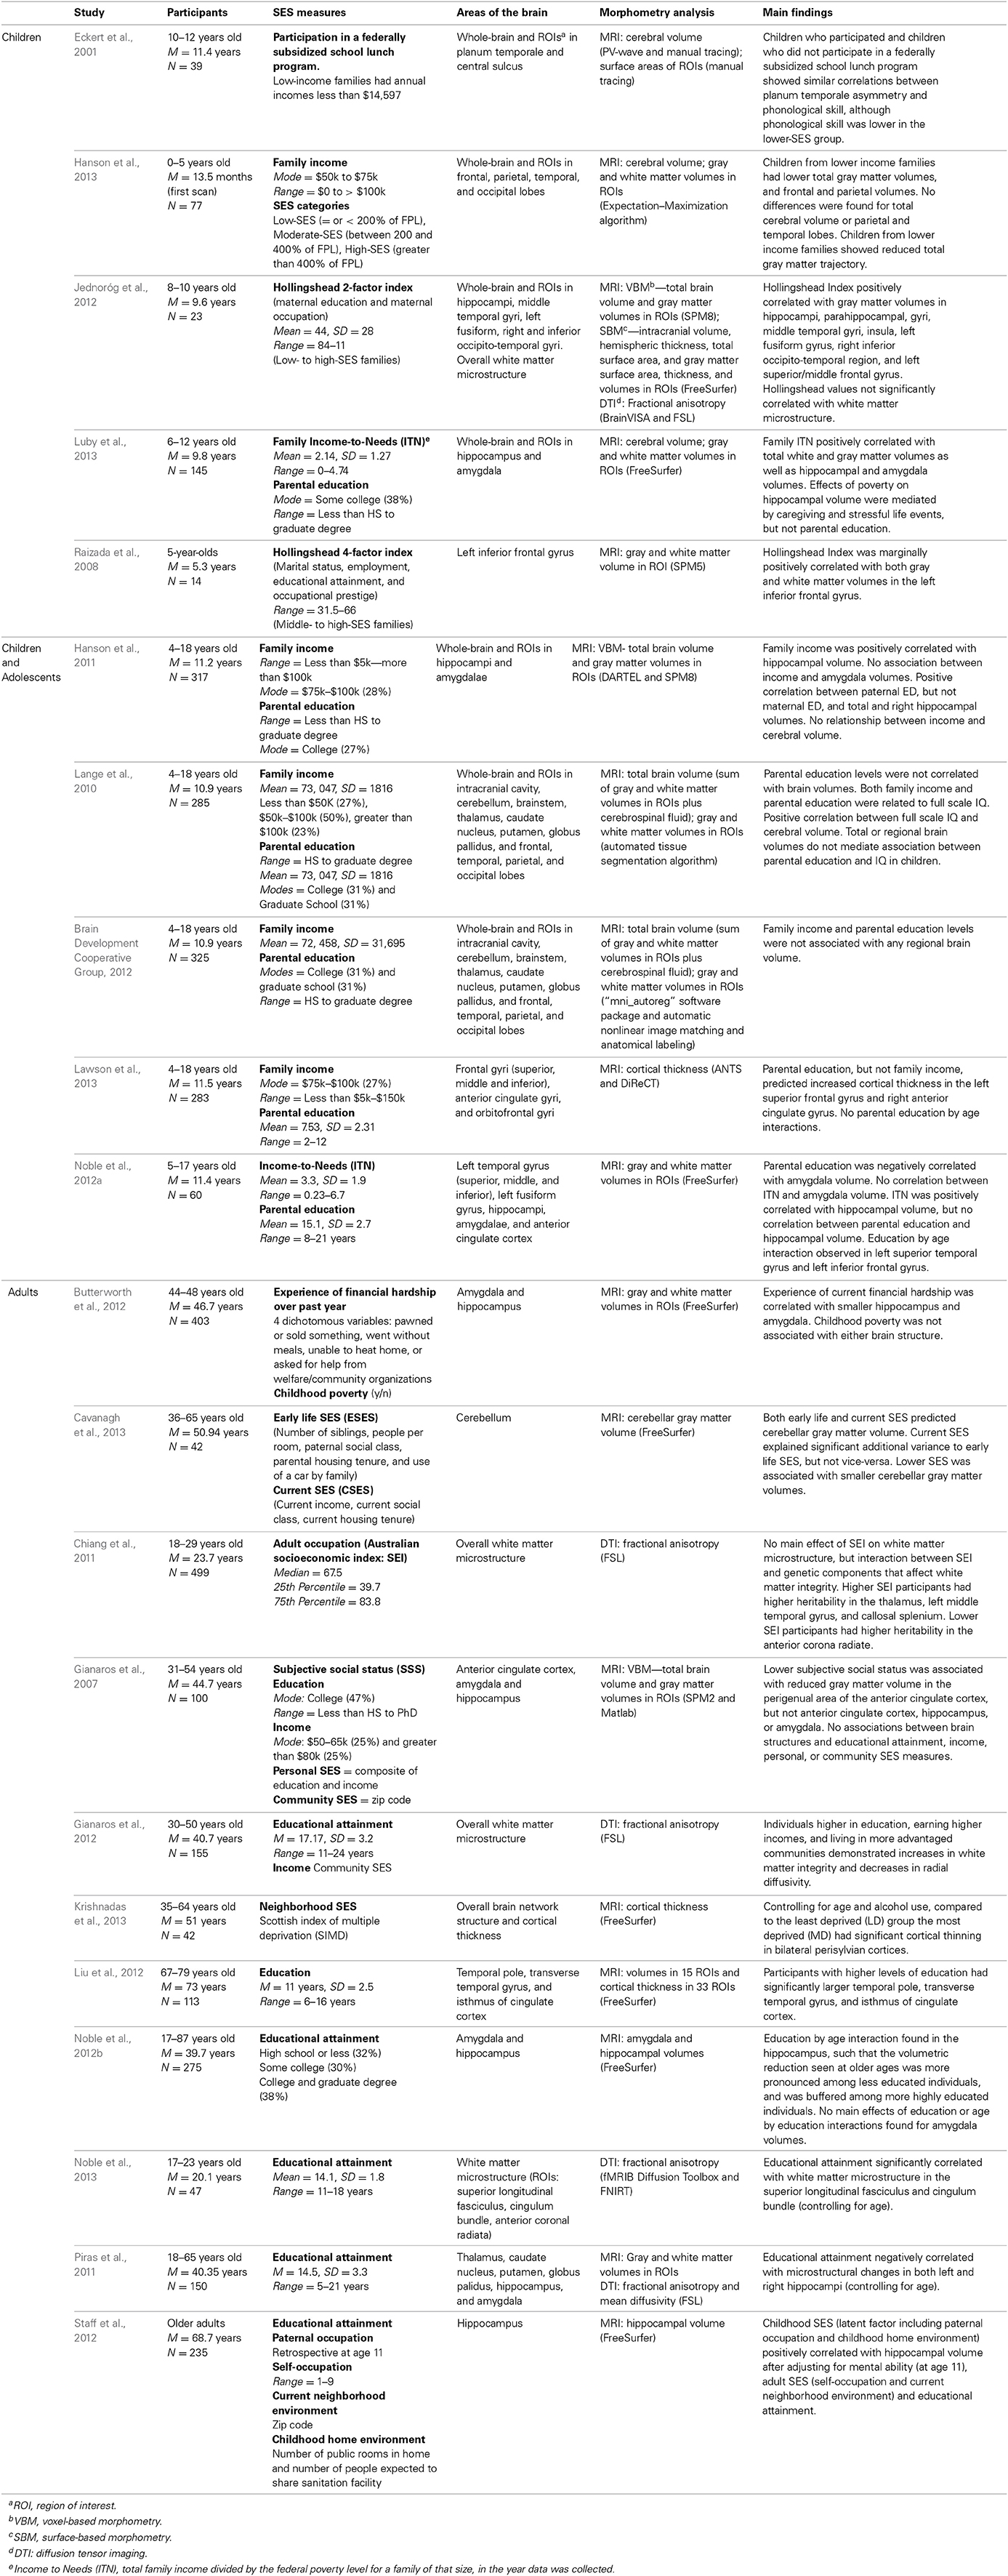
Table 1. Studies reporting on associations between SES and structural brain development. [click link for full-size image]
SES Variables Reported in Structural Imaging Studies
Although many studies have reported a high degree of correlation between various components of SES, different socioeconomic factors reflect different aspects of experience and should not be used interchangeably (Duncan and Magnuson, 2012). For example, families with greater economic resources may be better able to purchase more nutritious foods, provide more enriched home learning environments, or afford higher-quality child care settings or safer neighborhoods. In contrast, parental education may influence children's development by shaping the quality of parent–child interactions (Duncan and Magnuson, 2012). The notion that these SES components might differentially influence development is supported by the neuroscience literature, in which whole-brain structural analyses (Lange et al., 2010; Jednoróg et al., 2012) and studies with a priori testing of regions of interest (Hanson et al., 2011; Noble et al., 2012a; Luby et al., 2013) have indicated that different SES components may be associated with different brain structural attributes. Additionally, SES disparities tend not to be global, but rather, are disproportionately associated with differences in the structures of the hippocampus, amygdala, and the prefrontal cortex (see Table 1).Income
Household or family income is usually calculated as the sum of total income, typically measured monthly or annually. Although income can be considered a continuous variable, many studies ask participants to select what category of income they fall into. For example, a participant may indicate that they earn between $30,000 and $60,000 dollars per year, and researchers often take the midpoint of the participant's estimate (i.e., $45,000), thereby reducing variability between participants. Income is one of the more volatile of the SES markers, as family circumstances frequently fluctuate across time, resulting in varying levels of income throughout childhood and adolescence (Duncan, 1988; Duncan and Magnuson, 2012). Income-to-Needs (ITN) is a similar marker of SES, in which total family income is divided by the official poverty threshold for a family of that size. Hanson et al. (2011); Noble et al. (2012a) and Luby et al. (2013) all find significant positive correlations between income/ITN and hippocampal size, with children and adolescents from lower SES families having smaller hippocampal volumes. Examining income-related differences in amygdala volumes, we find some discrepancies across studies. While both Hanson et al. (2011) and Noble et al. (2012a) find no association between income/ITN and amygdala volume, Luby et al. (2013) report a significant positive correlation, where children from lower income homes also have smaller amygdala volumes. The families in the latter study reported lower family income than the families in the other two studies; thus it may be possible that, unlike the hippocampus, substantial income insufficiency is necessary to observe structural differences in amygdala volumes.
KEY CONCEPT 3. Income-to-Needs
The ratio of total family income divided by the federal poverty level for a family of that size, in the year data were collected. A family living at the poverty line would have an income-to-needs of ratio of 1. In 2012, 20.4 million people reported an income below 50% of their poverty threshold, including 7.1 million children under the age of 18.Education
Parental education or educational attainment is usually measured by participants reporting their highest level (or their parents' highest levels) of education (e.g., college degree). While family income has been associated with resources available to the family and levels of environmental stress (Evans and English, 2002), parental education has been more closely linked to cognitive stimulation in the home (Hoff-Ginsberg and Tardif, 1995). Compared to parents with lower levels of education, parents with higher levels of education tend to spend more time with their children (Guryan et al., 2008), use more varied and complex language (Hart and Risley, 1995; Hoff, 2003), and engage in parenting practices that promote socioemotional development (Duncan et al., 1994; McLoyd, 1997; Bradley and Corwyn, 2002). Again, like income/ITN, we find some inconsistencies across studies when examining links between parental education and children's brain structure. Luby et al. (2013) and Noble et al. (2012a) find no significant correlations between parental education (measured as the average or highest level of education of any parents or guardians living in the home) and hippocampal volumes. Hanson et al. (2011) report a significant association between right hippocampal volumes and paternal, but not maternal, education levels. There are differences across studies in reported amygdala volumes as well. Whereas Noble et al. (2012a) find a negative correlation between parental education and amygdala volumes, Luby et al. (2013) and Hanson et al. (2011) find no association. These differences may be due in part to how parental education was measured (average parental education vs. separate indicators for mothers and fathers) and/or how parental education was coded (continuously vs. categorically).
Examining the relation between brain structure and one's own educational attainment in adulthood (as opposed to parental education), both Gianaros et al. (2012) and Piras et al. (2011) found positive associations between educational attainment and increases in white matter integrity using diffusion tensor imaging (indexed by increases in fractional anisotropy and decreases in mean diffusivity, respectively). Whereas Gianaros and colleagues found widespread associations, Piras and colleagues found that, once controlling for age, only microstructural changes in the hippocampi significantly correlated with educational attainment. Noble et al. (2012b) also found no simple correlation between reported educational attainment and either hippocampal or amygdala volumes in adulthood. Educational attainment did, however, moderate the association between age and hippocampal volume. Specifically, as has been reported previously, age was quadratically related to hippocampal volume, with the volume of this structure tending to increase until approximately the age of 30, at which point volume starts to decline (Grieve et al., 2011). Although this quadratic relation between hippocampal volume and age was present across the entire sample, the volumetric reduction seen at older ages was more pronounced among less educated individuals, and was buffered among more highly educated individuals. Differences in hippocampal structure between higher and lower educated individuals may therefore be most apparent in the later stages of the lifespan.Occupation
Occupations generally reflect education, earnings, and prestige (Jencks et al., 1988), and have been extensively studied as an important aspect of SES as they are directly related to both education and income. Chiang et al. (2011) found that occupational status, measured using the Australian Socioeconomic Index (SEI), a 0–100 scale based on an individual's occupational category, was not related to white matter integrity. However, the authors did find an interaction between occupational status and white matter integrity, controlling for subjects' age and sex. Specifically, higher SEI was associated with higher heritability white matter integrity in the thalamus, left middle temporal gyrus, and callosal splenium.SES Composite Measures
Some studies have combined different SES markers to create average or composite measures. Cavanagh et al. (2013) used indicators of early life SES (number of siblings, number of people per room, paternal social class, parental housing tenure, and use of car by family) and current SES (current income, current social class, and current housing tenure) to predict cerebellar gray matter volume. Both composite measures positively predicted cerebellar structure, where current SES explained significant additional variance to early life SES, but not vice-versa. Staff et al. (2012) also measured both childhood SES (indexed by paternal education and childhood home conditions) as well as adult SES (indexed by the individual's educational attainment, occupational status, and neighborhood deprivation). These authors reported a significant association between hippocampal volume and childhood SES, after adjusting for the individual's SES as an adult more than 50 years later. These results may suggest that early life conditions may have an effect on structural brain development over and above conditions later in life.
The Hollingshead scale (Hollingshead, 1975) is a commonly used measure of SES, which combines occupation and education (Two-Factor Index) or occupation, education, marital status, and employment status (Four-Factor Index). Duncan and Magnuson (2003) have argued that aggregating these SES measures is faulty as fluctuations within each measure of SES differentially affect parenting and child developmental outcomes. Imaging studies using these composite measures of SES have found significant correlations between composite scores and regions in the medial temporal lobe and frontal lobe (Raizada et al., 2008; Jednoróg et al., 2012), but without knowing associations to specific SES markers, it is difficult to compare these studies with other structural imaging studies.Neighborhood SES
Of note, SES can describe a single participant, the participant's family or even the participant's neighborhood. The neighborhood context is associated with various health outcomes (Pickett and Pearl, 2001) as it is another source of potential exposure to stressors (e.g., violence) or protection from them (e.g., community resources, social support). Some studies have found correlations between neighborhood disadvantage and cognitive outcomes independent of individual level SES (Wight et al., 2006; Sampson et al., 2008), whereas others have not (Hackman et al., 2014). Studies examining neighborhood SES and brain structure have also had mixed findings. Gianaros et al. (2007, 2012) have used census tract level data (median household income, percentage of adults with college degrees or higher, proportion of households below federal poverty line, and single mother households) to create composite indicators of community SES. Although community SES was not associated with total brain volume or gray matter volumes in regions of interest (Gianaros et al., 2007), community SES was positively associated with white matter integrity independent of self-reported levels of stress and depressive symptoms (Gianaros et al., 2012). Similarly, Krishnadas et al. (2013) found that neighborhood SES, indexed using the Scottish Index of Multiple Deprivation, was related to cortical thickness, with men living in more disadvantaged areas demonstrating more cortical thinning in areas that support language function (bilateral perisylvian cortices) than men living in more advantaged areas.
KEY CONCEPT 4. Cortical thickness
Defined in neuroimaging studies as the shortest distance between the white matter surface and pial gray matter surface.Subjective Social Status
Finally, subjective social status is another marker of SES used in some research. In these studies, participants are typically asked to indicate on a drawing of a ladder where they believe they rank in terms of social standing among a particular group. In past studies, lower social ladder standings have been correlated with negative physical and mental health outcomes (Adler et al., 2000; Kopp et al., 2004; Hu et al., 2005), even after accounting for objective measures of education, income, and potential reporting biases (Adler et al., 1994). Gianaros et al. (2007) found that subjective social status was not correlated with hippocampal or amygdala volumes, but was significantly associated with reduced gray matter volume in the perigenual area of the anterior cingulate cortex (pACC). This finding may be understood by recognizing that the pACC is a region in the brain involved in experiencing emotions and regulating behavioral and physiological reactivity to stress. Measures of subjective social status may not take into account objective measures of SES, but relate more to the individual's experience of disadvantage.Words of Caution in Selecting SES Variables
Collecting and utilizing multiple independent measures of SES is necessary to accurately assess structural brain changes throughout development. SES is too complex to be captured by a single indicator or even a composite measure. Each measure of SES is its own distinct construct with varying associations with experience and cognitive development. However, while SES variables are not interchangeable, they are nonetheless highly correlated. It is therefore essential to avoid model multicollinearity in statistical analyses. This may be accomplished by first carefully considering which variables are most appropriate for testing particular hypotheses, and then confirming low variance inflation factors (VIF) within the model. Increasing sample size, centering variables, and utilizing residuals are additional methods to avoid inappropriate analysis and interpretation.
As a final word of caution, many of the SES indicators referenced above are based on studies completed in Western countries. Further work will be necessary to explore the generalizability of findings across different countries and cultures (Minujin et al., 2006; Lipina et al., 2011).
Covariates, Mediators, and Moderators
When examining SES disparities in brain structural development, additional demographic factors must be considered as well. First and foremost, the age of the participant must be taken into account, as brain structural volumes change significantly across childhood and adolescence (Paus et al., 1999; Lenroot and Giedd, 2006). Further, the timing of volumetric growth and reductions vary across different brain structures (Grieve et al., 2011). Inconsistencies in results across studies highlighted above may therefore be due to variability in the age ranges of the samples studied. Caution is advised when generalizing results reported within a narrow-age-range sample, as SES disparities in brain structure may vary substantially as a function of age.
Several studies include relatively wide age ranges, recruiting, for example, both children and adolescents in their imaging samples (Lange et al., 2010; Hanson et al., 2011; Noble et al., 2012a; Lawson et al., 2013). Two additional studies have taken a lifespan approach to examining SES and structural brain development (Piras et al., 2011; Noble et al., 2012b). Incorporating wide age ranges into a study allows researchers to consider whether results vary as a function of participant age. For example, both Noble et al. (2012b) and Piras et al. (2011) examine associations between subcortical structures and educational attainment in a wide age range of participants. Piras et al. (2011) found that microstructural changes in the hippocampus, but not changes in gross volume in this structure, were significantly predicted by education levels. However, due to a large negative correlation between education and age, the decreases in microstructure may have been more closely related to older age than greater education. As discussed above, Noble et al. (2012b) reported that higher levels of educational attainment buffered against age-related reductions in hippocampal volume, signifying that the association between age and hippocampal volume is not constant across all levels of education. Of course, distinctions between development and decline are, in some respects, arbitrary, and may be more appropriately classified according to functional rather than structural measures.
Sex is another important demographic characteristic to consider. Volumetric variation in brain structures increase within and between males and females during puberty (Sowell et al., 2003). Sex differences have been reported for cortical thickness. Using a longitudinal sample of participants ages 9–22 years, Raznahan et al. (2010) observed differences in cortical maturation, with males demonstrating a thicker cortex in frontopolar regions at younger ages and subsequent greater cortical thinning than females during adolescence. It has also been reported that females demonstrate more rapid cortical thinning than males in specific cortical areas (right temporal, left temporoparietal junction, and left orbitofrontal cortex) corresponding to the “social brain” (Mutlu et al., 2013). It will be important in future work to better understand how the links between SES variables and structural brain development may vary by sex, and/or a combination of sex and age.
In addition, studies have reported that families living in chronic poverty have differential outcomes based on when and for how long poverty was experienced (National Institute of Child Health and Human Development Early Child Care Research Network, 2005). While the brain is most malleable in early childhood, it nonetheless retains a substantial degree of plasticity throughout the lifespan, and the extent to which the timing and duration of socioeconomic disadvantage are associated with brain structural differences is virtually unexplored in the neuroscience literature to date.
Finally, it is important to consider environmental exposures and experiences that may account for links between distal socioeconomic factors and brain structural differences. For example, Luby et al. (2013) recently reported that links between income and hippocampal volume were mediated by caregiving support/hostility and stressful life events. Of course, there are many potential experiential correlates of SES that have not been well studied in the context of SES disparities in brain development, including nutrition, exposure to environmental toxins, safety of the play environment, or quality of the child's linguistic environment. In order to develop interventions that effectively target the SES gap in achievement, it will be essential to try to understand the particular component(s) of the environment that are most influential in explaining disparities.
Volume vs. Cortical Thickness/Surface Area
Differences in findings across studies may also be accounted for by the techniques used to measure morphometry. Most studies examining SES differences in brain structure have reported cortical volumes as their outcome of interest (but see Jednoróg et al., 2012; Liu et al., 2012; Krishnadas et al., 2013; Lawson et al., 2013). However, cortical volume is a composite measure that is determined by the product of surface area and cortical thickness, two genetically and phenotypically independent structures (Panizzon et al., 2009; Raznahan et al., 2011). Though the cellular mechanisms are not fully understood, it has been hypothesized that symmetrical cell division in the neural stem cell pool contribute to exponential increase in the number of radial columns that result in surface area, without changes to cortical thickness. In contrast, asymmetrical cell division in founder cells is independently responsible for a linear increase in the number of neurons in the radial column, leading to changes in cortical thickness but not surface area (Rakic, 2009). As such, these two properties of the cortical sheet develop differentially; cortical surface area tends to expand through childhood and early adolescence and decrease in adulthood, whereas cortical thickness tends to decrease rapidly in childhood and early adolescence, followed by a more gradual thinning and ultimately plateauing (Schnack et al., 2014). Cortical thinning is related to both synaptic pruning and increases in white matter myelination, resulting in a reduction of gray matter as measured on MRI (Sowell et al., 2003). These maturational changes occur concurrently and together contribute to the development of the mature human brain.
KEY CONCEPT 5. Cortical volumes
The most commonly used outcome in studies of socioeconomic disparities in brain structure. Cortical volume is actually a composite of cortical thickness and surface area, two genetically and phenotypically distinct morphometric properties of the brain.
KEY CONCEPT 6. Surface area
The area of exposed cortical surface or convex hull area (CHA) and the area of cortex hidden in sulci.
Thus, studies in which the dependent measure is cortical volume may not adequately reflect the complexities of morphometric brain development. Indeed, cross-sectional comparisons of cortical volume are poor indicators of brain maturation (Giedd and Rapoport, 2010), whereas cortical thickness has been shown to be a more meaningful index of brain development (Sowell et al., 2004; Paus, 2005) and has been associated with both cognitive ability (Porter et al., 2011) and behavior (Shaw et al., 2011). For example, IQ has been correlated with the trajectory of cortical thickness, such that, during childhood, more intelligent children have thinner cortices than children with lower IQ, with this association strengthening through adolescence. In contrast, by middle adulthood, a thicker cortex is related to higher IQ (Schnack et al., 2014). Importantly, IQ has also been independently correlated with the trajectory of surface area development, such that more intelligent children exhibit greater surface area during childhood, though surface area expansion is completed earlier and then decreases more quickly in more intelligent adults (Schnack et al., 2014). Together, these findings suggest that both surface area and cortical thickness may be critical in accounting for individual differences in cognitive abilities, and that these factors must be considered independently rather than lumping them into a single composite measure of cortical volume.
In summary, when considering associations between experience and brain morphometry, cortical thickness and surface area should be assessed separately, rather than reporting on the composite metric of cortical volume (Winkler et al., 2010; Raznahan et al., 2011). Research investigating cortical complexity and its association with SES variables will be vital to further understanding how environmental influences over the life course influence structural brain development.
Conclusions
Children living in socioeconomic disadvantage are more likely to experience cognitive delays and emotional problems (Brooks-Gunn and Duncan, 1997), but the underlying causal pathways between disadvantage and developmental outcomes are not clear. The nascent field of socioeconomic disparities in brain structure is an exciting one, which holds promise in helping to understand this question. However, while progress has been made in understanding how socioeconomic disparities may affect brain development, there are many avenues for further research. Careful social science approaches to assessing individual socioeconomic factors must be combined with cutting-edge neuroscientific approaches to measuring precise aspects of brain morphometry. Consideration of how results interact with demographic factors such as age and sex are critical. Differences in exposures and experiences that may mediate socioeconomic disparities in brain development must be rigorously assessed to help identify or confirm underlying mechanisms.
Although this review has focused on SES disparities in brain structure as opposed to function, it is readily acknowledged that the two approaches are complementary. While a structural approach lends itself to greater spatial resolution as well as, arguably, more precision in understanding proximal experience-dependent mechanisms, it is limited in terms of functional interpretations. Ultimately, linking both structural and functional imaging to cognitive outcomes is essential for examining associations between anatomy, physiology, and behavior. Brain structural measures can be viewed as mediators between SES and cognition, or as outcome variables in their own right; having clear theoretical pathways ensures accurate interpretation of results and implications, and will help inform the design of effective policies, emphasizing early and targeted interventions.Conflict of Interest Statement
The authors declare that the research was conducted in the absence of any commercial or financial relationships that could be construed as a potential conflict of interest.Acknowledgment
The authors are grateful for funding from the Robert Wood Johnson Foundation Health and Society Scholars program and the GH Sergievsky Center.
References at the Frontiers site
Author Biography

Natalie H. Brito, is a Robert Wood Johnson Health and Society Scholar at Columbia University. She received her PhD in Psychology with a concentration in Human Development and Public Policy from Georgetown University. Dr. Brito's research focuses on how early environmental variations shape the trajectory of cognitive development. She has published work examining multiple language exposure and memory development. Currently, she is connecting her previous work in bilingualism with research into socioeconomic disparities.

Kimberly G. Noble, is a developmental cognitive neuroscientist and pediatrician in the Department of Pediatrics and the G.H. Sergievsky Center at Columbia University. She received her undergraduate, graduate, and medical degrees from the University of Pennsylvania, and completed post-doctoral training at the Sackler Institute for Developmental Psychobiology at Weill Cornell Medical College. Dr. Noble's research focuses on socioeconomic disparities in child neurocognitive development. She is interested in understanding the time course with which socioeconomic disparities in brain development emerge, the mechanisms via which exposures and experiences contribute to specific neurocognitive outcomes, and in applying this knowledge to the development of public health-focused interventional strategies.


